
30 Mar 2026
Attractive valuations, greater fiscal headroom versus developed markets (DMs), scope for rate cuts, and a constructive outlook for AI-driven demand and certain commodities make it a compelling time to invest in EM equities.
Wide dispersion in returns, valuations and corporate governance standards across EM creates a strong case for taking a selective approach to the market.
At an increasingly attractive time for EM equities, we believe our strategies offer a compelling way to access the asset class and are well-positioned to capture opportunities through active, bottom-up stock selection.
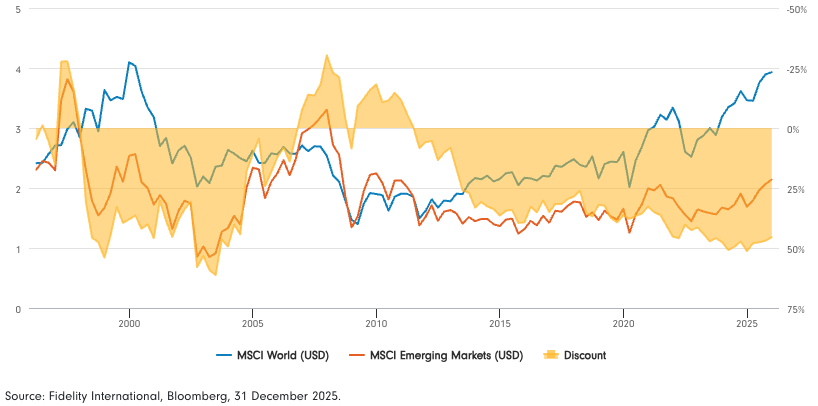
EM was among the best performing equity markets in 2025, outperforming the US for the first time since 2017. Because of that, it’s easy to forget that the market continues to trade at a deep discount to the US and the rest of the world (see chart 1). Up until the end of 2024, weakness in China, and an environment of structurally higher interest rates and a strong USD had driven a de-rating in the market, leading to several decades of underperformance vs DMs.
However, 2025 saw several of these factors beginning to shift, with a weaker dollar, falling interest rates, momentum in certain key commodities such as copper and gold, and signs of recovery in parts of the Chinese market supporting the asset class. Also supportive was the presence of a growing base of investors starting to look beyond the US for alternatives. And with the asset class still trading at a ~40% discount versus the rest of the world, there could be scope for continued re-rating in the market this year.
EM trades at a ~40% discount versus the rest of the world
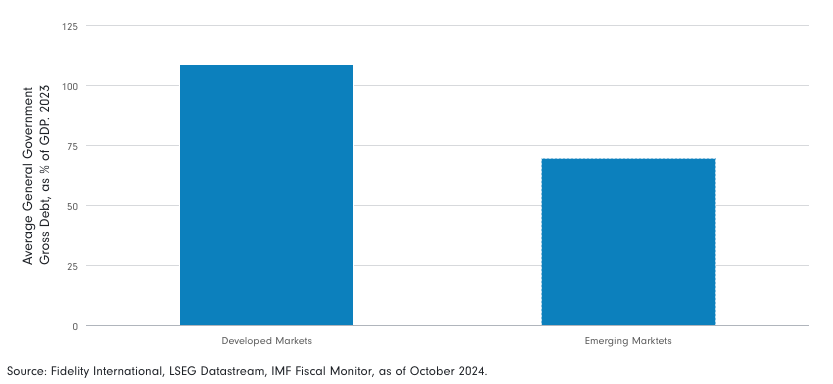
There are also several fundamental reasons why EM looks particularly well-placed to outperform as we move into 2026. Firstly, the fiscal backdrop continues to look supportive across much of the universe relative to the developed world. This in part reflects a hangover from Covid-19, when many DMs handed out fiscal stimulus packages to support the consumer, whilst we saw the opposite in many EMs, especially China, which tightened its belt and sought to deflate the property market. As a result, the fiscal backdrop looks much healthier for many EMs, with the exception of notable outliers like Brazil, leaving much of the asset class looking more resilient versus history. Whilst many DMs are less well-placed to carry out targeted fiscal support, greater fiscal headroom in most EMs also provides scope to shift towards expansionary fiscal policy where required, which could help cushion any downside risks to growth.
The fiscal backdrop looks superior in EM vs. DM
In addition, the fiscal backdrop in the US has weighed on sentiment towards assets such as the US dollar, putting downward pressure on the currency, which pulled back significantly in 2025. Should the dollar continue to weaken or even remain flat, this would prove supportive for EM, given a weaker dollar reduces debt servicing costs and imported inflation for EM and supports commodity prices, boosting local currencies and strengthening consumer purchasing power. However, it is worth noting that although US dollar weakness remains a tailwind for the asset class, it is not the only driver for EM outperformance. Many EM economies benefit from increasingly sophisticated capital markets and therefore carry less dollar-denominated debt than in the past, meaning EM outperformance is not reliant on continued USD weakness.
Finally, the monetary policy backdrop also looks supportive for much of the region. Many EMs raised rates early in 2021-22 to combat inflation, and real rates remain high, most notably in Brazil, but also in several EMEA markets too. As a result, many of these EMs have a long runway to further ease policy should the Fed continue to cut rates, which should create a supportive environment for equity valuations.
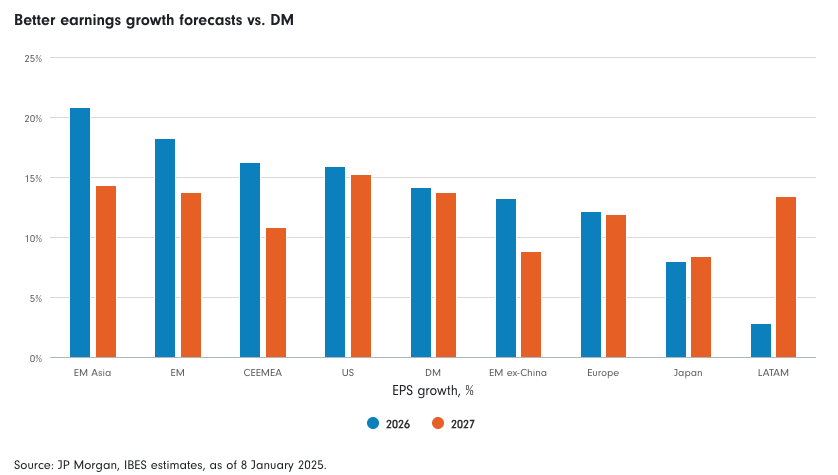
The earnings growth outlook also looks positive for EM. Consensus estimates expect EM earnings growth to accelerate to 18.2% in 2026, a notable premium versus DMs and the US, which looks especially attractive considering EM’s valuation discount. Although the drivers of these earnings estimates are broad-based, as the country breakdown below shows, a key contributor is tech heavy markets such as Taiwan and Korea, and commodity-driven economies such as South Africa.
Another factor driving US markets higher in recent years has, of course, been optimism around AI. What has been overlooked, however, is the fact that the majority of the AI supply chain is located in EM markets like Taiwan, and to a lesser extent Korea.
It is likely that much of the of value accrual from AI and datacentres will go to EM companies, and we see significant opportunity to gain exposure to these tech companies vital to the AI supply chain, that often offer superior revenue growth to many US tech companies at much cheaper multiples.
One example of this phenomenon is among manufacturers of ethernet switches, an input in datacentres, where Taiwanese business Accton competes with a US peer, Celestica. Whilst the two companies have near identical operating models, Accton has superior fundamentals and revenue growth, and a closer relationship with the end customer, reflected in a deeper integration into its supply chain. Despite that, it trades at around half the multiple to Celestica – showing the value opportunities which are on offer in the EM tech space.
Another key driver for the EM asset class is the increasingly ‘goldilocks’ type backdrop for commodity prices, with what could be continued strength in key mined commodities such as copper and gold met with a muted backdrop for oil prices.
The backdrop for copper looks particularly favourable. Here, structurally stronger demand for the metal, driven by EVs, growing datacentre use and electrification, is coupled with falling supply, due to a lack of new greenfield projects and declining mine quality. For gold, whilst the market has moved a long way and price moves are much less easy to forecast than for a commodity like copper, it appears that many of the positive drivers for the precious metal remain intact, given the continued tailwind from central banks looking to diversify away from US Treasuries, with gold remaining a low proportion of total reserves in markets like China.
Finally, China warrants separate consideration given its considerable weight in the EM index. Here, the backdrop is complex, with the outlook for the consumer remaining challenged.
However, there are some bright spots in the market, particularly within several emerging industrial sectors, where we are seeing rapid innovation among Chinese companies. There are several key areas where China is moving up the value chain, including some of the world’s emerging and fastest growing export segments, such as batteries, semi components, and robots. Here, growing levels of R&D spend, combined with a large, skilled talent pool - with China having the world’s highest proportion of tertiary graduates in a STEM field2 - are driving innovation and market share gains.
There are a confluence of factors making EM a particularly attractive asset class today. The valuation backdrop remains supportive, with potential for further re-rating in 2026 despite the rally in 2025. Similarly, the fundamental outlook looks attractive, supported by a superior fiscal backdrop, the potential for further rate cuts, and strong earnings growth potential across the region, underpinned by structural growth in tech, a constructive outlook for key commodities, and innovation in China.
The dispersion on offer within EM also creates a particularly constructive environment for stock picking. We have seen a huge bifurcation in valuations at the country level, with the cheapest markets such as South Africa, Brazil and Mexico de-rating, whilst the most expensive, including India and Taiwan, have become more expensive. This offers considerable valuation opportunities among the broader index. Significant divergence in country-level returns, uneven corporate governance standards, and heightened sensitivity to headlines also mean there are plenty of segments of the market to avoid, pointing to the need for selectivity. As a result, EM equities offer significant opportunity for investors willing to take an active approach to the market.
Past performance does not predict future returns. The fund’s returns may increase or decrease as a result of currency fluctuations.
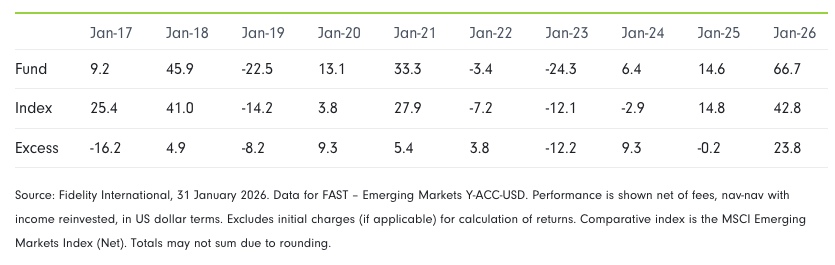
FAST - Emerging Markets Fund Y-ACC-USD vs. MSCI Emerging Markets Index (Net), Rolling 12-month returns, net of fees USD (%)
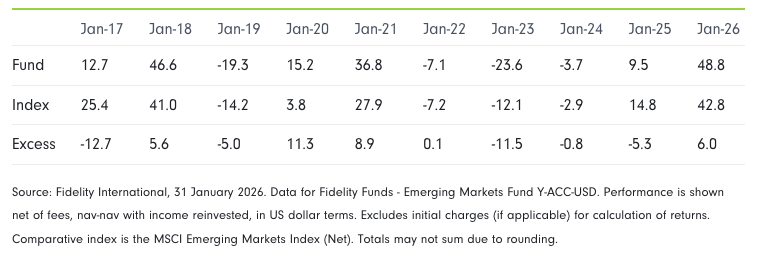
FF - Emerging Markets Fund Y-ACC-USD vs. MSCI Emerging Markets Index (Net), Rolling 12-month returns, net of fees USD (%)
1 Emerging Markets Equity Strategy, December and CY 2025 wrap, JP Morgan, 2 January 2026.
2 CEIC, OECD, Morgan Stanley Research, January 2026.
3 GEMS long-only: FF – Emerging Markets Fund, FIF IX Emerging Markets Fund. GEMS ESG: FF – Emerging Markets Equity ESG Fund. GEMS long-short: FAST – Emerging Markets Fund, Fidelity Emerging Markets Limited. GEMS ex China: FF – Emerging Markets ex China Fund. Regional funds: FF – EMEA Fund, FF – Latin America Fund.
4 Data refers to the FAST Emerging Markets Fund, FF Emerging Markets ex China Fund, FF EMEA Fund, Y-ACC-USD share classes, net of fees in USD, as at 31 January 2026. *Since tenure (1 February 2023) for the FF Emerging Markets ex China Fund.
5 Data refers to the FF Emerging Markets Fund, Y-ACC-USD share class, net of fees in USD, as at 31 January 2026.
Author
Amber Gordon is an Associate Investment Director in the Equity Investment Directing Team in London. Amber joined Fidelity in December 2020 and is currently the Investment Director for Fidelity’s Global Emerging Markets Equity franchise. Her prior industry experience includes roles in content marketing and investment writing both at Fidelity International and Federated Hermes. She started her career in 2015 as an Editorial Researcher at The Economist. Amber holds a BA (Hons) in History from Trinity College, University of Cambridge.