

14 Jun 2024
Following months of pain for bond markets hit by stubborn inflation and high interest rates, front-end credit remains a relative safe haven for investors, continuing to provide attractive relative risk adjusted returns. Here, our portfolio managers analyse the impact of so-called “wipeout” yields and spreads and outline why current attractive levels mean that the performance of front-end bonds is now much more insulated from further yield rises or spread widening than it has been in the past.
Key points
For the last six months, we have gradually been reducing spread duration and upping the credit quality in our funds through shortening trades (adding 0-5yr maturity sterling credit). We are implementing these trades because they allow us to pick-up yield whilst reducing credit risk due to the combination of inverted yield curves and flat credit curves. Short-dated credit currently looks appealing for a number of reasons but given the growing uncertainty surrounding the timing of the Bank of England (BoE) interest rate cuts, we are particularly focussed on the attractive wipeout yields available in front end-credit.
What are wipeout yields?
Wipeout yields, also known as breakeven rates, are calculated as the yield-to-maturity divided by interest rate duration. They are expressed as the increase in yields required to “wipeout” one year of carry and so the larger they are, the greater the buffer against increased yield volatility or further yield rises. Short dated credit tends to have a high wipeout yield due to its combination of attractive yield levels and low duration (high numerator, small denominator).
Wipeout yields have risen over the past few years.
Over the past few years, wipeout yields have risen considerably with the front-end (sub-5yr duration bonds) now looking notably more attractive. Below we look at every bond in the sterling investment grade credit market and measure their wipeout yield in Q3 2021 vs Q1 2024. In Q3 2021, wipeout yields were 0.2% across the market as a whole, with few bonds offering a wipeout yield greater than 1%, meaning that if yields were to increase by just 0.2%, the market would be expected to return nothing. Between Q3 2021 and Q3 2022, 10yr yields rose a record-breaking 3.5% as the BoE started to hike interest rates. With a breakeven rate of just 0.2%, this explains why returns were so poor during the period; a low starting yield coupled with a huge rise in rates.
Wipeout yields have increased dramatically since the BoE rate hikes
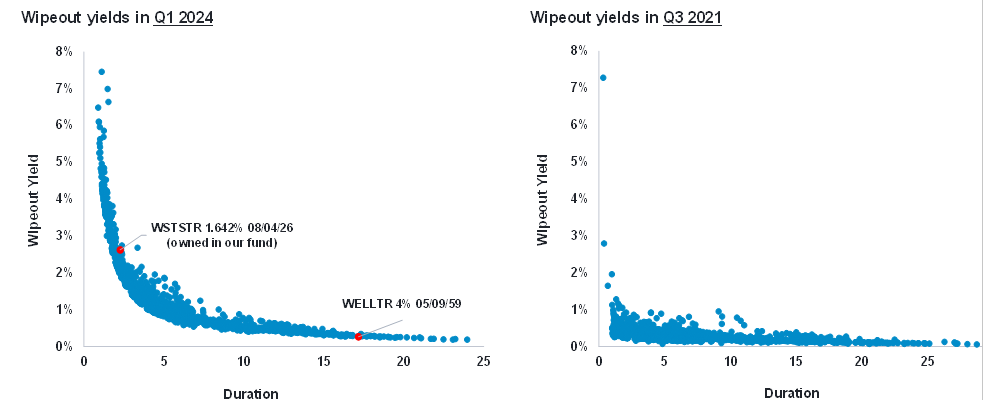
Source: Bloomberg, March 2024. Displays all the bonds in the ICE BofA Euro-Sterling Index (E0L0) at the time.
We are now in a completely different market, with front-end credit offering wipeout yields anywhere between 1% to 8% and on average, 1.9%. We do not anticipate that yields will rise by more than 1.9% in one year and thus expect that investors could generate positive returns by investing in the front-end. Given current yields, it is very unlikely that we will have a repeat of 2022. Between September 2021 and September 2022, yields rose 3.5% which wiped out the equivalent to 10.5yrs worth of carry. In comparison, if yields were to rise 3.5% now, it would take less than 2yrs to make back the lost carry.
Within the credit universe, the front-end offers the most value.
As shown below, the wipeout yield for 1-5yr Corporate Bonds is currently 1.9%, meaning that yields would need to rise by 1.9% to lose one year’s worth of carry. The wipeout yield for 1-5yr Corporate Bonds compares favourably to All-Maturity Corporate Bonds and All-Maturity Gilts, at 0.9% and 0.4% respectively. This is an attractive risk-adjusted option for investors seeking investment grade exposure but concerned about interest rate volatility.
Wipeout yields comparison across the credit spectrum
Source: Bloomberg, March 2024. Figures are based on the ICE BofA Indices: BofA UK Gilt Index (G0L0), BofA 1-5 Year Eurosterling Index (EVL0),
BofA Euro-Sterling Index (E0L0), BofA 10+ Year Eurosterling Index (E9L0) and BofA Sterling High Yield Index (HL00) as above.
As expected, sterling high yield offers the highest wipeout yield (high yield and low duration), but this involves greater credit risk and a higher beta to negative risk events. To put these figures into context, during the worst risk off event in the last decade, the COVID sell-off in March 2020, short dated investment grade credit widened by 1.1%. During the same period, high yield credit widened by 5.5%, 5x the beta of investment grade. Given our current position in the economic cycle, where spreads are already very compressed and the double-B to triple-B spread is very low, we think that it makes sense to start switching from high yield into investment grade.
A tale of two stories…
Given that investment grade credit is traded on spread, we can also look at wipeout spreads to get a more tangible understanding of the breakeven point from a credit spread perspective. Wipeout spread measures the spread move required to ‘wipeout’ a year’s worth of spread carry. Similar to wipeout yields, there is a clear inversion pattern with the front-end offering the most value. We have picked out two bonds from the sterling IG universe to illustrate our point.
Wellcome Trust (WELLTR) is a high-quality triple-A rated issuer that operates as a non-profit organisation offering medical and health facilities to communities in the UK. The curve is inverted with the 2059 maturity bond trading 18bps tighter than the 2036 maturity bond. As of March 2024, the credit spread for the 2059 bond was 15bps and the spread duration was 17.8yrs, indicating a wipeout spread of just under 1bp.
This implies that if spreads were to widen just 1bp, that would wipeout one year of spread carry. The 2059s have widened +14bps since the end of March with the spread to benchmark currently at 29bps, indicating that more than fourteen years of carry have already been wiped out! Moreover, the current bid-ask spread is 6bps which is around 7x the wipeout spread for the bond. We see little value in owning these types of bonds at this point in the cycle, hence our underweight position. This is not an isolated occurrence and there are numerous other long-end bonds with similar characteristics.
In comparison, Westfield Stratford (WSTSTR) is an A+ rated bond secured on the Stratford shopping centre. As of March 2024, the credit spread for the 2026 WSTSTR bond was 197bps and the spread duration was 2.3yrs, indicating a wipeout spread of 86bps. This implies that it would take 84bps of spread widening to wipe out one year of spread carry.
Again, to give context, this is 5bps more than the spread widening we saw during the COVID sell-off when all shopping centres were closed indefinitely. We can hence conclude that it would take an extreme event for bondholders not to do better than gilts. This bond, therefore, offers an appealing risk-adjusted return which we have reflected through our overweight position in the bond across our Short Dated Corporate Bond, Sustainable Moneybuilder Income and Sterling Corporate Bond Funds.
Important information
This information is for investment professionals only and should not be relied upon by private investors. Past performance is not a reliable indicator of future returns. Investors should note that the views expressed may no longer be current and may have already been acted upon. The value of bonds is influenced by movements in interest rates and bond yields. If interest rates and so bond yields rise, bond prices tend to fall, and vice versa. The price of bonds with a longer lifetime until maturity is generally more sensitive to interest rate movements than those with a shorter lifetime to maturity. The risk of default is based on the issuers ability to make interest payments and to repay the loan at maturity. Default risk may therefore vary between government issuers as well as between different corporate issuers. Due to the greater possibility of default, an investment in a corporate bond is generally less secure than an investment in government bonds. Fidelity’s range of fixed income funds can use financial derivative instruments for investment purposes, which may expose them to a higher degree of risk and can cause investments to experience larger than average price fluctuations. Reference in this document to specific securities should not be interpreted as a recommendation to buy or sell these securities and is only included for illustration purposes.