Dan Green, CFA, Vice President, Portfolio Manager - UK Equity
Key highlights
- Historically, long-run returns for this cohort have been impressive versus other market capitalisations
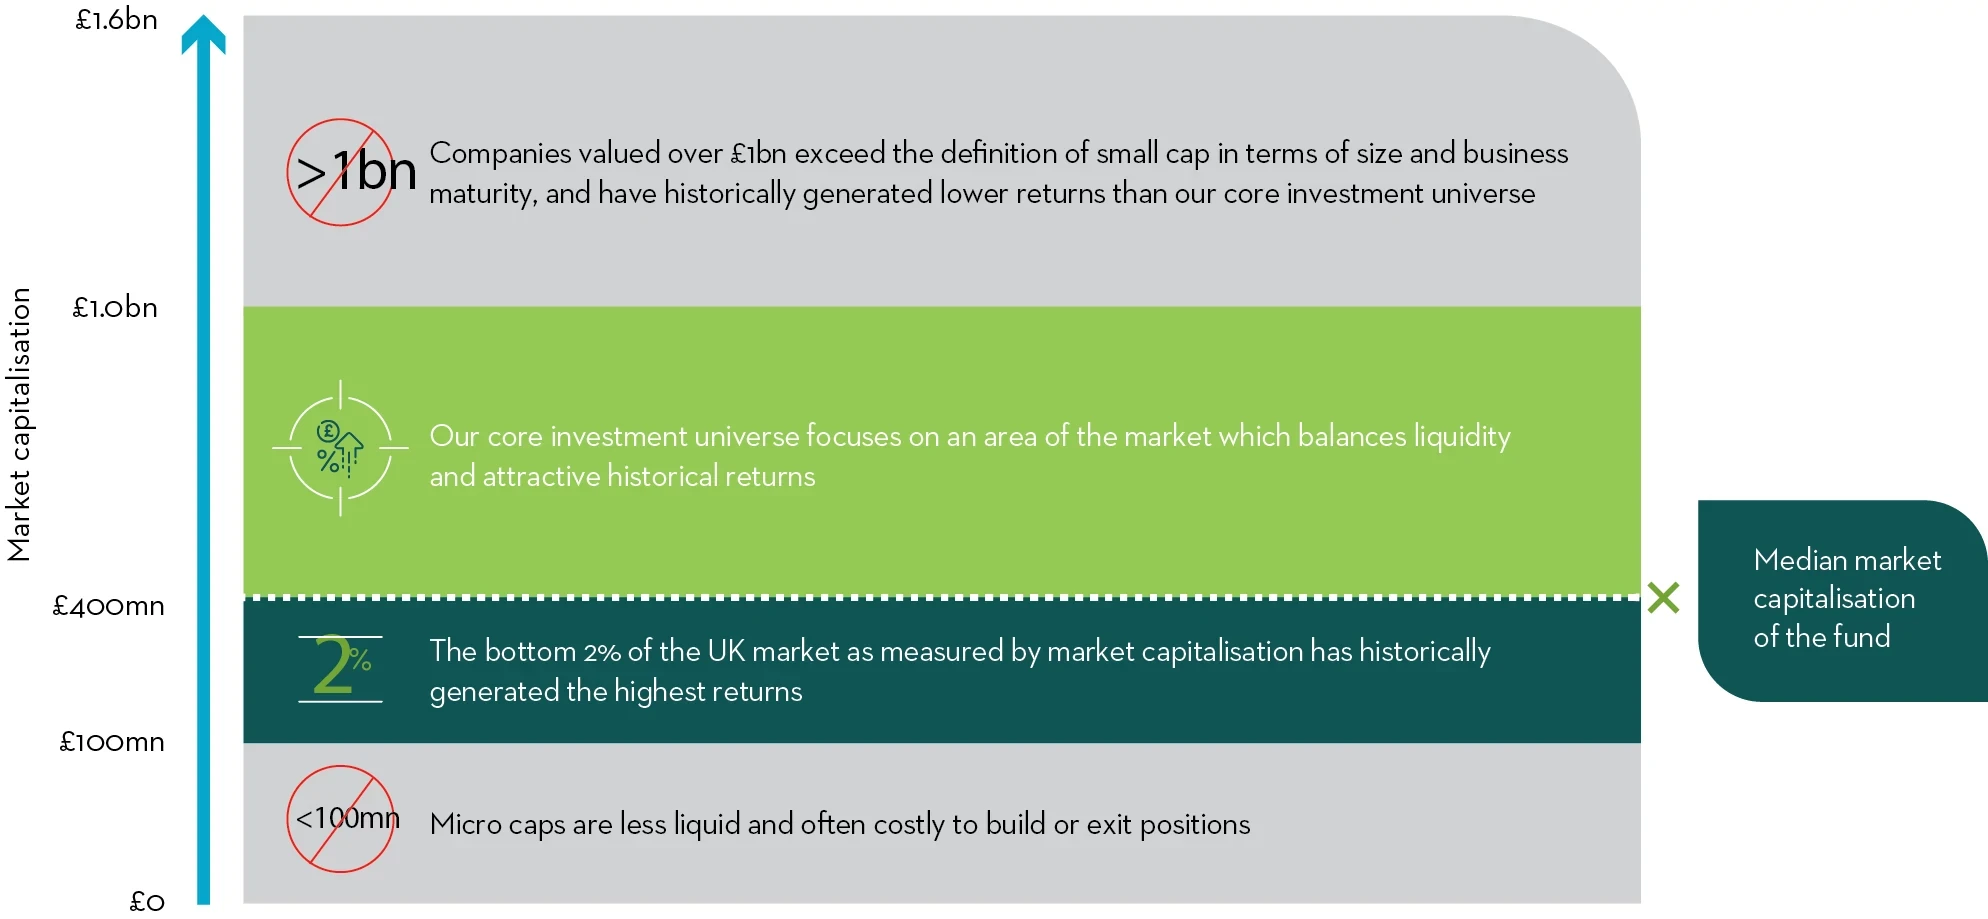
- Our UK smaller companies strategy considers the sweet spot for small cap investing to be companies with a market cap of between £100m and £1bn.
- Lower levels of analyst coverage provide opportunities for active managers
- And, why we have avoided ‘fallen angels’
UK Smaller companies have historically generated greater returns
The ‘Numis Indices 2022 Annual Review’ shows that smaller businesses in the UK have generated greater returns over the long run. While it’s not possible to invest directly in an index and any gains would not include fees, expenses, or sales charges, the Numis Smaller Companies Index (Ex IT’s) (NSCI) has advanced by 8,326% since 1955. This is the same as a 14.2% annual increase over the period and beats the Numis mid cap index by 1.4% per year (12.8% per annum). This empirical research also demonstrates that the greatest returns for UK equity asset classes have been delivered by companies valued in the bottom 2% of UK equity market capitalisation. Please see figure one, below.
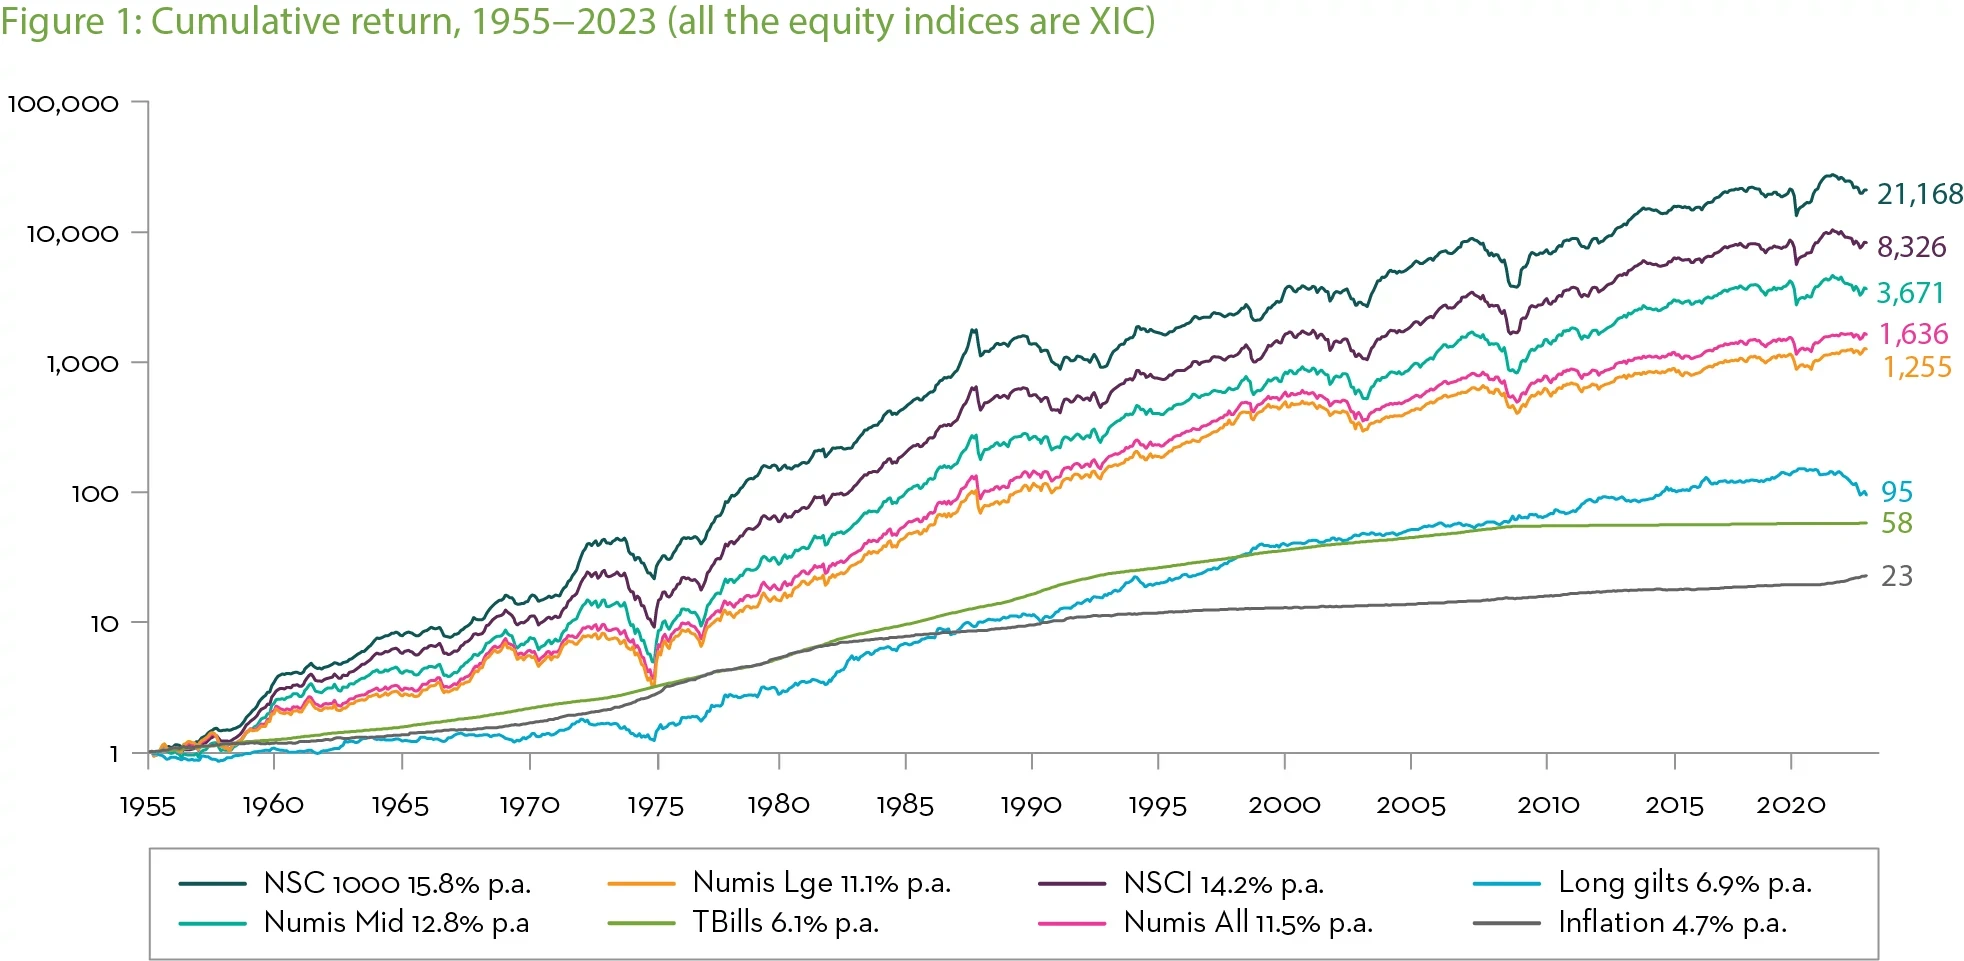
Source: Numis Indices 2022 annual review
Why our ‘sweet spot’ is 100m-£1bn
In the Martin Currie UK Smaller Companies strategy, we maintain a disciplined focus on companies within a market capitalisation range between £100m and £1bn, our definition of small cap. This provides investors clear differentiation between our small- and mid-cap offerings but there are also some compelling reasons to hunt within this range including: impressive long run returns versus other market capitalisations and the fact that lower levels of analyst research present opportunities for active managers.
The NSCI is our benchmark and the latest rebalance cuts off at companies valued at £1.6bn and above. Historically, returns have diminished as one ascends the capitalisation spectrum so if we were to move up the market cap range, we would be broadening our universe to those businesses that have historically generated lower returns. Even taking into consideration the possibility of heightened volatility lower down the market cap scale, this is one of the reasons that we prefer to stick within our £100m to £1bn market cap range.
Whilst no universal definition exists, we believe that businesses valued above £1bn are not ‘small cap’ in terms of business size and maturity. As our strategy is a specialist small cap mandate, we believe that it would be inappropriate to add new portfolio businesses that we do not define as small cap.
On the flip side, if we were to begin looking at companies with a market cap below £100m, we think liquidity becomes a concern and could impact our ability to buy or sell positions. We therefore define these companies as micro cap.
At the beginning of April, the median market capitalisation of the Martin Currie UK Smaller Companies portfolio is £392m and 88% of the portfolio assets were valued below £1bn. Those valued above £1bn were first bought when they were valued below our £1bn threshold and have since grown to exceed it.
We believe that this market cap profile healthily aligns to the areas of the market that have been most successful over the last 67 years. According to the Numis indices 2022 annual review, the greatest returns over this period have been generated by companies that have sat in the bottom 2% of UK market capitalisation, which is currently around £400m and below. There are risks with all investment, and this market cap range in particular includes risks of high volatility and liquidity.
Figure 2. Our market cap sweet spot is between £100m and £1bn
Diminishing sell-side coverage presents opportunities
We believe that the smaller the company, the likelihood of asset mispricing increases. One reason behind this is the MiFID II overhaul on permissible sell-side research activity, which has seen broker research coverage of smaller companies narrowing from both a quantity and quality perspective.
The below chart shows the average number of analysts covering each market capitalisation band. Five years ago, 11 analysts on average covered £500m-£1bn market cap names. This has now reduced to five and this trend continues as you move down the market cap scale.
With less coverage amongst these smaller names, market inefficiencies arise and create better opportunities for market mispricing that can be exploited by active fund managers.
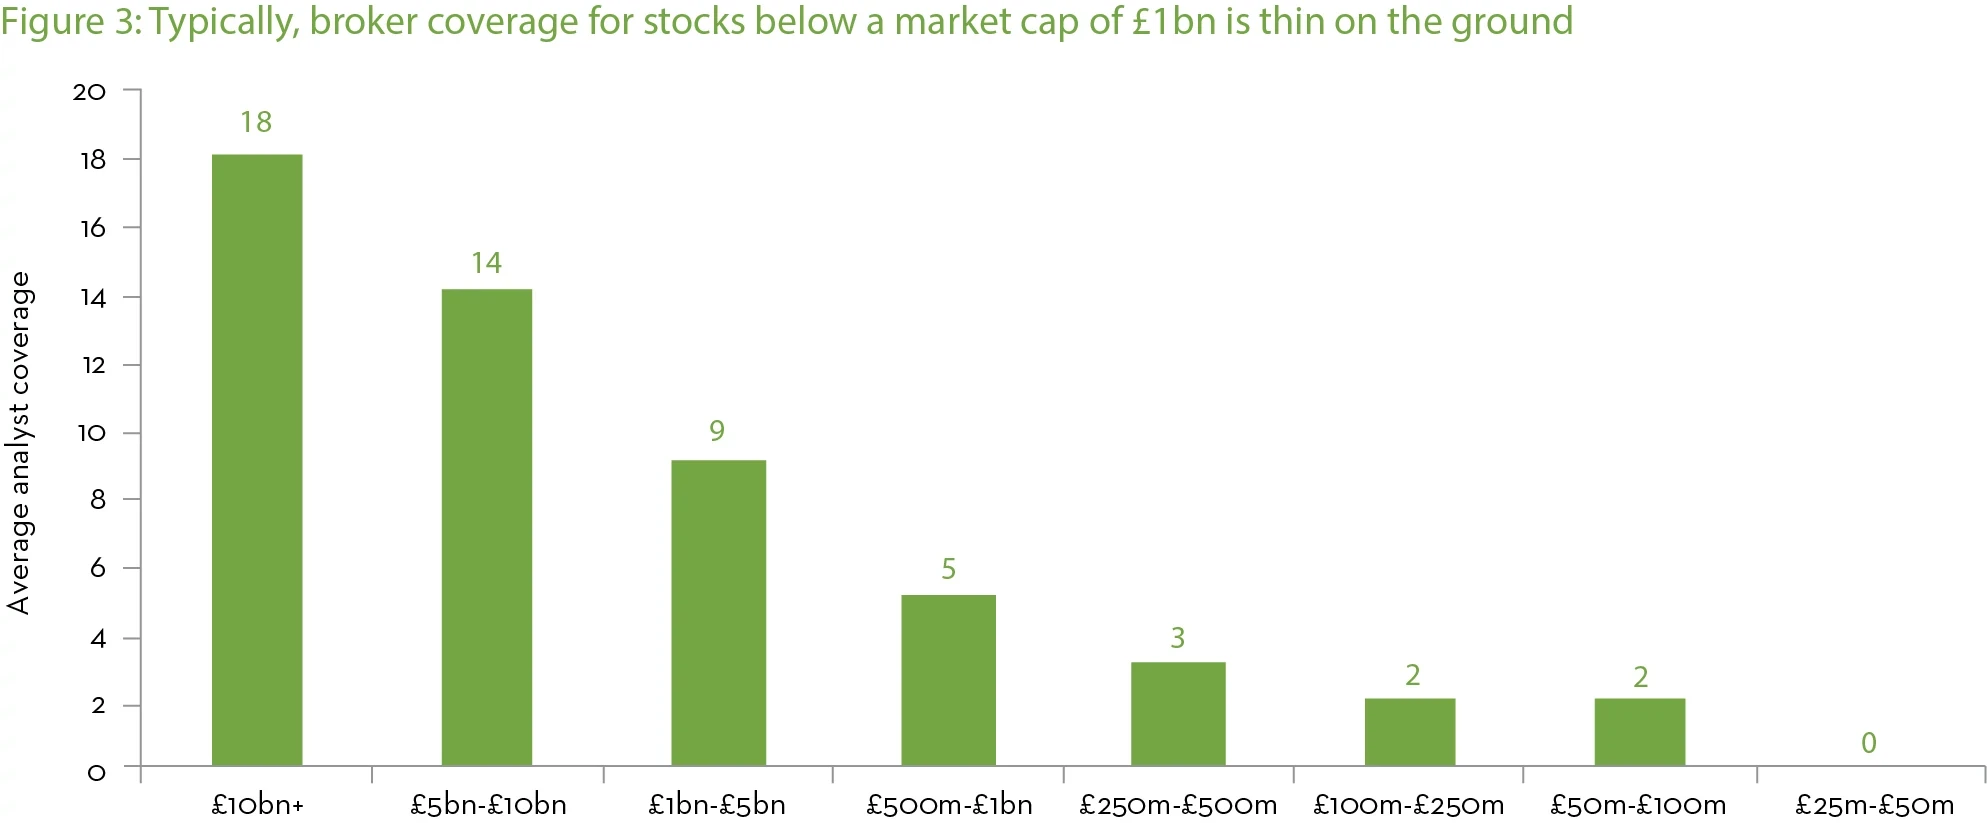
Source: Numis Securities Research, as at 31 December 2022.
The index is annually rebalanced but have avoided ‘fallen angels’
The benchmark for our UK smaller companies strategy is the Numis Smaller Companies Index (NSCI), which is rebalanced on an annual basis to reflect the lowest 10% of market capitalisation within the UK stock market. At the start of 2023, this meant the largest company in the index had a market cap of £1.6bn.
2022 was a strong relative year for the UK in general but much of this performance was driven by a small cohort of just 25 FTSE 100 businesses.
These mega cap companies were typically resource heavy giants in their respective fields. However, this narrow performance led to some significant shifts in index construction throughout the UK. As a result, many businesses dropped into the mid cap index from the large cap space, and into the smaller companies index from the mid cap space. Businesses that have been downgraded from a larger index to a smaller index are typicalled referred to as fallen angels.
The high levels of volatility have led to 29 of these ‘fallen angels’ making up 26% of the 2023 NSCI value – this is the highest ever and is over double the previous year. The impact that this has is profound – typically these businesses are not highly rated by the market and this has resulted in a significant de-rating of the index given their relatively large index weighting.
The price to earnings ratio (PE) of the NSCI dropped from 10x at the end of 2022 to 8.1x at the beginning of 2023. Along with an accompanying rising dividend yield, the fallen angels effect has significantly tilted the index towards value and against momentum factors. This has generated headwinds for the performance of our core/growth investment style, which has underperformed the index as value has performed well.
In addition, we find many of these fallen angels unattractive on a fundamental basis as they fail to meet our quality criteria. For example, one strong performer year-to-date is 7x leveraged. We would not consider a business this indebted as investable, irrespective of its size.
If we analyse the historic effect of buying fallen angels vs ignoring them since 1955, on average owning the fallen angels within the index has detracted from annual returns by 0.1%.1
Offering investors a clearly defined UK small cap opportunity
We remain conscious of size/style drift at all times and our disciplined focus means we will not deviate from this in pursuit of short-term opportunity.
The FTSE 250 is broadly considered the proxy for UK mid cap businesses and the median market capitalisation of this index is £1.1bn (£1.9bn if we exclude investment trusts).
Inevitably, there is some crossover between the NSCI and the FTSE 250. However, we believe that by focussing our efforts on companies valued between £100m and £1bn, we are investing in the areas of the market that have historically generated the greatest returns. Consequently, we are offering a clear-cut UK smaller companies strategy to investors.
Important Legal Information
1. Numis Securities Research, as at 31 December 2022.
This material is intended to be of general interest only and should not be construed as individual investment advice or a recommendation or solicitation to buy, sell or hold any security or to adopt any investment strategy. It does not constitute legal or tax advice. This material may not be reproduced, distributed or published without prior written permission from Franklin Templeton.
The views expressed are those of the investment manager and the comments, opinions and analyses are rendered as at publication date and may change without notice. The underlying assumptions and these views are subject to change based on market and other conditions and may differ from other portfolio managers or of the firm as a whole. The information provided in this material is not intended as a complete analysis of every material fact regarding any country, region or market. There is no assurance that any prediction, projection or forecast on the economy, stock market, bond market or the economic trends of the markets will be realized. The value of investments and the income from them can go down as well as up and you may not get back the full amount that you invested. Past performance is not necessarily indicative nor a guarantee of future performance. All investments involve risks, including possible loss of principal.
Any research and analysis contained in this material has been procured by Franklin Templeton for its own purposes and may be acted upon in that connection and, as such, is provided to you incidentally. Data from third party sources may have been used in the preparation of this material and Franklin Templeton ("FT") has not independently verified, validated or audited such data. Although information has been obtained from sources that Franklin Templeton believes to be reliable, no guarantee can be given as to its accuracy and such information may be incomplete or condensed and may be subject to change at any time without notice. The mention of any individual securities should neither constitute nor be construed as a recommendation to purchase, hold or sell any securities, and the information provided regarding such individual securities (if any) is not a sufficient basis upon which to make an investment decision. FT accepts no liability whatsoever for any loss arising from use of this information and reliance upon the comments, opinions and analyses in the material is at the sole discretion of the user.
Products, services and information may not be available in all jurisdictions and are offered outside the U.S. by other FT affiliates and/or their distributors as local laws and regulation permits. Please consult your own financial professional or Franklin Templeton institutional contact for further information on availability of products and services in your jurisdiction.
Issued in UK: Issued by Franklin Templeton Investment Management Limited (FTIML), registered office: Cannon Place, 78 Cannon Street, London EC4N 6HL. Tel: +44 (0)20 7073 8500. Authorized and regulated in the United Kingdom by the Financial Conduct Authority.
Please visit www.franklinresources.com to be directed to your local Franklin Templeton website.
Copyright © 2023 Franklin Templeton. All rights reserved.
