
21 Mar 2023
Paul Jackson, Global Head of Asset Allocation Research
Want to find out more? View the RSMR Factsheet here:
Invesco Corporate Bond Fund (UK)
Invesco Bond Income Plus Trust
Invesco Distribution Fund (UK)
Invesco Global Bond Fund (UK)
Invesco High Yield Fund (UK)
Invesco Monthly Income Plus Fund (UK)
Invesco Tactical Bond Fund (UK)
Key takeaways
Where are we now and how did we get here?
Prices rose across the board in 2022. By the end of the year, a loaf of white bread in the UK hit an average of £1.30 from about £1.00 compared to a year earlier.1 Across the Channel, a cut of beef rump in France set consumers back an extra 6%.2 Germans paid almost 35% more for milk.3 In Italy, the cost of eating out at a restaurant rose almost 8% year on year.4 On the Iberian Peninsula, Spanish wine cost 9.3% more.5 The price of flowers in the Netherlands went up some 7%6 and, further north, a pastry in Sweden cost 16% more.7
Inflation, as the data above shows, surprised to the upside last year, causing most central banks to abruptly remove the support that had propelled financial markets to elevated levels. Russia’s invasion of Ukraine didn’t help, with commodity prices pushed higher than they would otherwise have been.
Vladimir Putin’s war has also underscored Europe’s reliance on Russian oil and gas. Every European country has had to rethink its energy mix and consider energy security, balancing that against the demands of the energy transition. In many ways, the conflict in Ukraine has proved to be a real-world stress test for environmental, social and governance (ESG) investing.
Last year was a tough year for most assets, including fixed income. In addition to inflation, most asset categories were expensive at the start of 2022 – a result of the extremely accommodative fiscal and monetary policies introduced during the global pandemic.
Now, high inflation and the higher interest rates central banks have responded with are a recipe for economic slowdown, in our opinion. The fact that we anticipate further deceleration in the global economy could suggest that we will remain in a contraction regime over the coming months. In other words, below-trend, falling growth with a risk of recession. Yet there is scope in our view for investors to find returns in fixed income, despite the challenging economic environment.
In our fixed income playbook, we explore two potential scenarios to help you navigate the uncertainty and assess potential opportunities.
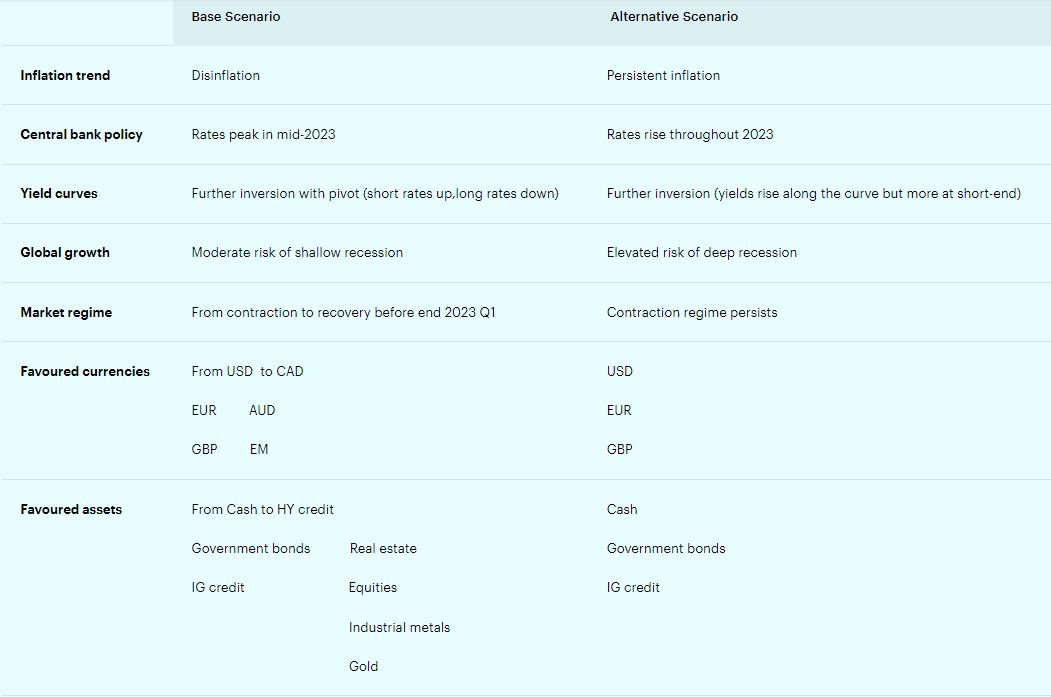
Our Base Scenario is of disinflation9. The portfolio stance in this scenario is overweight risk relative to a neutral allocation. We expect a re-acceleration in growth, with higher bond yields, looser monetary policy, and an increasing global risk appetite.
In the high inflation environment of the past year or so, central banks have resorted to monetary tightening (or interest rate hikes) to try to control inflationary pressures. Lower inflation removes the pressure on central banks to tighten. Bond prices move up when interest rates fall, which would happen in our Base Scenario of disinflation.
Also, inflation reduces the value of a bondholder’s coupon interest payments. Thus, the lower inflation, the lower the negative impact on the coupon’s real value. Riskier assets (such as high yield and emerging market debt) will likely outperform quality credit. In this scenario, we expect fixed rates would outperform variable rates and long duration would outperform short duration.
However, we need to consider the Alternative Scenario and the possibility that we could be wrong about the path of inflation and central bank policies. If inflation remains stubbornly high (or goes even higher), then we believe central banks will continue tightening for longer, with terminal rates higher than in our Base Scenario and yield curves inverting further. We believe this would increase the risk and depth of the recession, keeping markets in a contraction regime.
The Alternative Scenario is underweight in its risk stance relative to a neutral policy stance. We would expect a difficult investment environment with the potential for weakness in most asset classes. In this scenario, we are underweight equities relative to fixed income, tilted to defensives, quality and low volatility. The Alternative Scenario is underweight risky credit and overweight government bonds and duration; and is also overweight US dollar.
Figure 1 gives a summary of the two scenarios (disinflation and persistent inflation), along with asset preferences.
From a fixed income perspective, our Base Scenario allows us to switch preferences towards riskier assets such as high-yield credit and emerging market assets, while the alternative high inflation scenario would drive us to stick with a preference for defensive assets such as cash and government bonds – although we like investment grade (IG) credit in both scenarios.
Figure 1. Two scenarios for 2023 and our favoured assets
 Source: Invesco.
Fixed income strategies in 2023
Under normal circumstances, defensive fixed income assets (government bonds and IG credit) are usually among the best performing assets in periods like these (based on historical performance – see Figure 2). However, we note that financial asset performance in 2022 did not fit the usual contraction regime, with fixed income assets performing as badly as stocks, for example.
Recent market performance suggests that financial markets may be transitioning to a recovery regime, with riskier assets (like high yield credit) performing better. Though economic deceleration could bring market volatility and periods of doubt, we suspect that the transition to a recovery regime could be complete by the end of the first quarter of 2023.
We suspect that market participants are looking ahead to the end of Fed’s tightening cycle, anticipating a peak in interest rates in mid-2023. We would agree with this.
Figure 2. Historical excess returns on US assets during the economic cycle
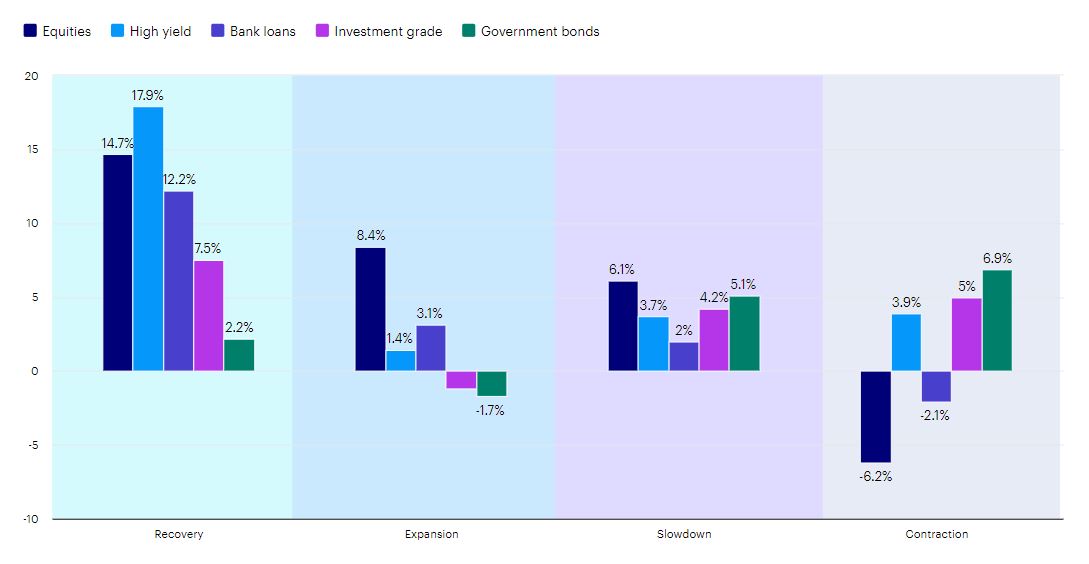
Notes: Index return information includes back-tested data. Returns, whether actual or back tested, are no guarantee of future performance. Annualised monthly returns from January 1970 – December 2021, or since asset class inception if a later date. Includes latest available data as of most recent analysis. Asset class excess returns defined as follows: Equities = MSCI ACWI - US T-bills 3-Month, High Yield = Bloomberg Barclays HY - US T-bills 3-Month, Bank loans = Credit Suisse Leveraged Loan Index – US T-bills 3-Month, Investment Grade = Bloomberg Barclays US Corporate - US T-bills 3-Month, Government bonds = FTSE GBI US Treasury 7-10y - US T-bills 3-Month. For illustrative purposes only. Please see appendices for further information. Sources: Invesco Investment Solutions’ proprietary global business cycle framework and Bloomberg L.P.
Fixed income options by geography
United States
For the US, we expect the best returns potential on long duration bonds and prefer credit (both IG and HY) to government bonds.
United Kingdom
We think it likely that the best returns in the UK will be on long duration bonds. We are neutral between credit and sovereign debt (the elevated risk of recession reduces the outlook for credit versus the US).
Europe
In Europe, the best returns are likely to be on long duration bonds. As with the UK, we are neutral between credit and sovereign debt (the elevated risk of recession reduces the outlook for credit versus the US).
China
After relatively good performance in 2022, we expect Chinese fixed income assets to underperform their developed world counterparts in 2023. We prefer short duration instruments. There is a slight preference for credit, based largely on the higher yields.
Where is the yield curve heading?
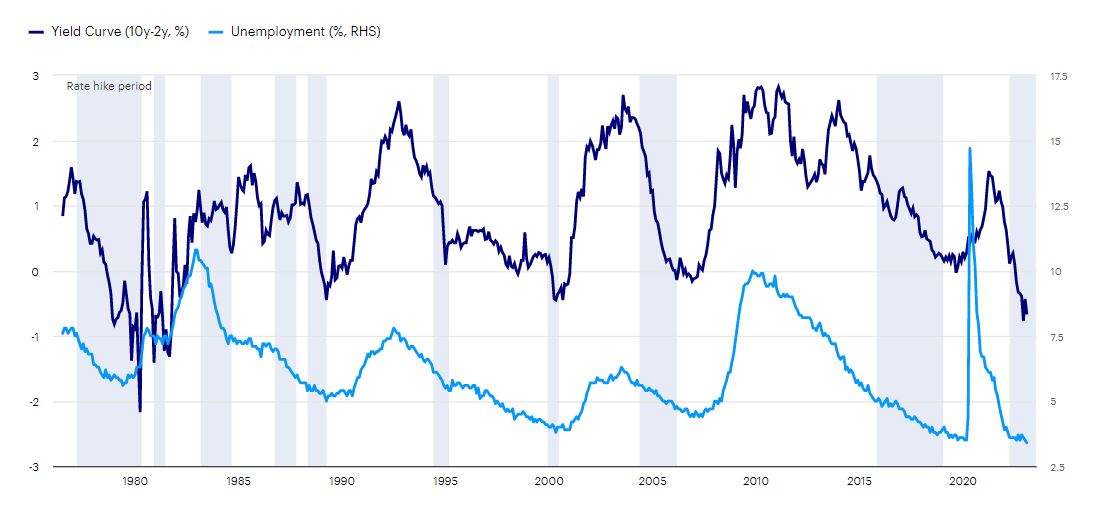
In our Base Scenario, there is a market expectation that central bank rates will continue climbing, providing successively higher potential returns on cash and possibly leading to further inversion of yield curves. Figure 3 shows that the Fed typically keeps tightening until around the time that unemployment bottoms. However, given that unemployment was already extremely low when the Fed started this tightening cycle (and that inflation is consequently high), the Fed may want to make sure that unemployment is rising before it stops hiking. Normally, the yield curve (10y-2y) continues to invert until unemployment bottoms (see Figure 3). If unemployment is bottoming (as we believe) then we would normally expect the yield curve to steepen from here (except when measured from very short maturities, such as three months). Even if short-term yields fall more than long yields, we believe the effect of duration will favour long bonds and therefore lengthening duration.
Figure 3. US unemployment, the yield curve and Fed tightening cycles
Note: Past performance is no guarantee of future results. Monthly data from September 1986 to November 2022 (as of 30 November 2022). IG and HY spreads are calculated by subtracting the redemption yield on the ICE BofA US Treasury Index, from the redemption yields on the ICE BofA US Corporate Index and the ICE BofA US High Yield Index, respectively. The dotted lines show the average spreads over the full period shown. Source: ICE BofA, Refinitiv Datastream and Invesco
The case for high yield and investment grade credit
In our Base Scenario we now favour both HY and IG credit versus government debt. In our Alternative Scenario, we see government debt and IG credit as preferred options.
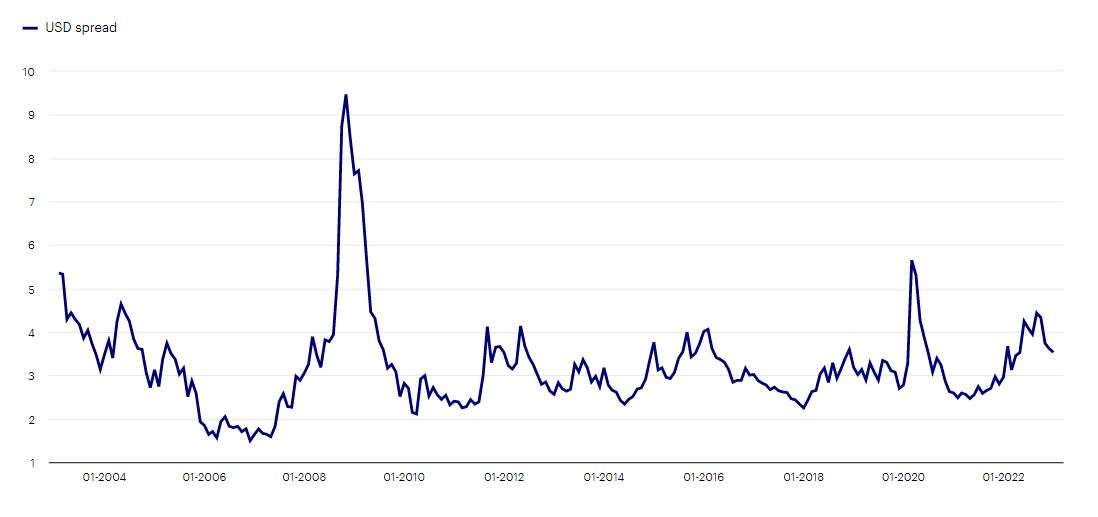
When considering spreads, we note that US credit spreads have widened towards historical norms during 2022 but remain just short of those benchmarks (see Figure 4). We see the potential for credit spreads to widen further as economies weaken, but we note a recent narrowing as markets start to look forward to an end to central bank tightening and eventual economic recovery. Even if we allow for a slight widening of those spreads, our projections suggest that total returns on credit will be higher than those on government debt in 2023.
Figure 4. US credit spreads versus treasury yields (%)
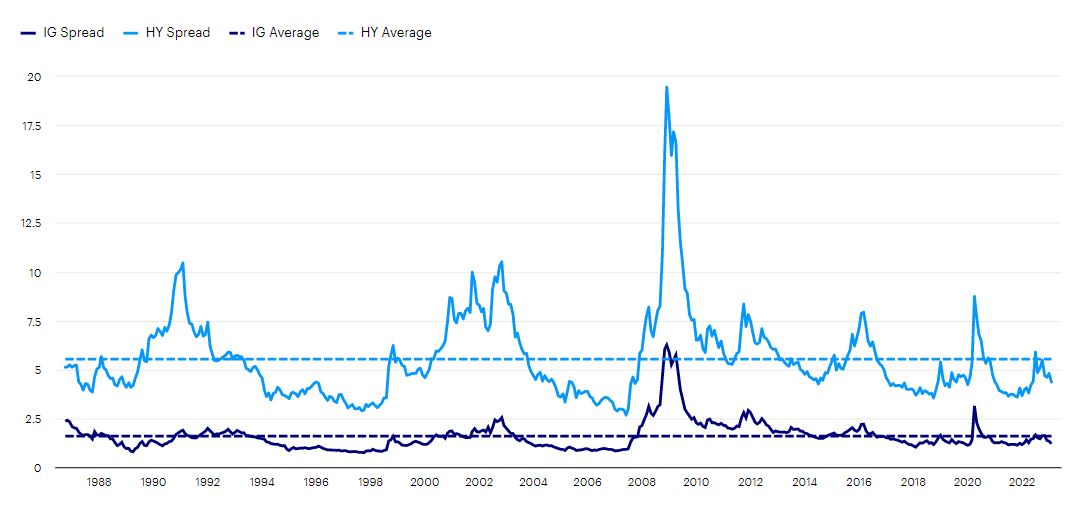
Note: Past performance is no guarantee of future results. Monthly data from September 1986 to November 2022 (as of 30 November 2022). IG and HY spreads are calculated by subtracting the redemption yield on the ICE BofA US Treasury Index, from the redemption yields on the ICE BofA US Corporate Index and the ICE BofA US High Yield Index, respectively. The dotted lines show the average spreads over the full period shown. Source: ICE BofA, Refinitiv Datastream and Invesco
Fixed income in emerging markets
Even better, the spread on emerging market (EM) debt appears more generous than usual. Figure 5 suggests that the spread on US dollar-denominated EM government debt versus that of the US is wider than normal (outside of the extraordinary periods of the global financial crisis and the Covid pandemic recession). The weakening of the US dollar that we expect in 2023 should help EM assets (in our view). We are more optimistic about EM fixed income assets than we are about their developed market (DM) counterparts, based on the assumption of a narrowing of those spreads. Furthermore, with a weakening of the US dollar, we suspect that local currency versions of EM debt will outperform hard currency versions, though with more volatility.
Figure 5. Emerging market USD government bond yield spread versus US (%)
Note: Past performance is no guarantee of future results. Monthly data from February 2003 to November 2022 (as of 30 November 2022). The chart shows the difference between the yield-to-worst on the Bloomberg EM USD 7-10 Year index and the yield to maturity on the US 10-year treasury yield. Source: Bloomberg, Refinitiv Datastream and Invesco
Fixed income and ESG: the opportunities
Russia’s war in Ukraine has had serious consequences for the energy mix of European countries, many of which have been dependent on cheap Russian energy. In response, governments in the European Union and UK have had to, in the short term, shift their focus to energy resilience rather than the energy transition. As a result, oil and gas stocks had a bumper year in 20229.
Broadly speaking, ESG shouldn’t normally be a cyclical phenomenon but its lack of exposure to energy stocks introduces a cyclical element. Part of our Base Scenario disinflation thesis is that energy prices are falling, with gas most likely to fall during 2023. We think this will weaken energy stocks, which could enable ESG indices to outperform.
Private credit and a diversified portfolio
Private credit is seen as a robust option for a diversified portfolio regardless of the economic environment. When compared to public assets, private markets offer enhanced income due to the exposure to additional credit and liquidity risk. But uncorrelated returns compared to traditional listed equities and bonds often drives strong and differentiated income, while reducing volatility.
There are a number of reasons for this. Senior secured loans, for example, take priority in the capital structure and have proved to be resilient through full economic cycles and interest rate environments. By way of example, senior loans posted positive returns in 28 years out of 31 in the period beginning 1992. Even in recessionary periods, the assets performed well. Data also shows that actual defaults undershot implied defaults throughout the market cycle.
In the distressed debt market, investors can find evergreen opportunity regardless of the credit cycle.
Direct loans to the middle market, meanwhile, offer some of the most attractive yields in performing credit and premiums to liquid debt markets. The middle market is vast, too. In the US alone it comprises more than 200,000 companies and there is significant private equity dry powder available that targets investment in this market.
Despite numerous rate increases in 2022, US senior loans performed steadily through the year, and outperformed other risks assets (Figure 6).
Figure 6. Steady loan returns stood in stark contrast to other risk assets in 2022
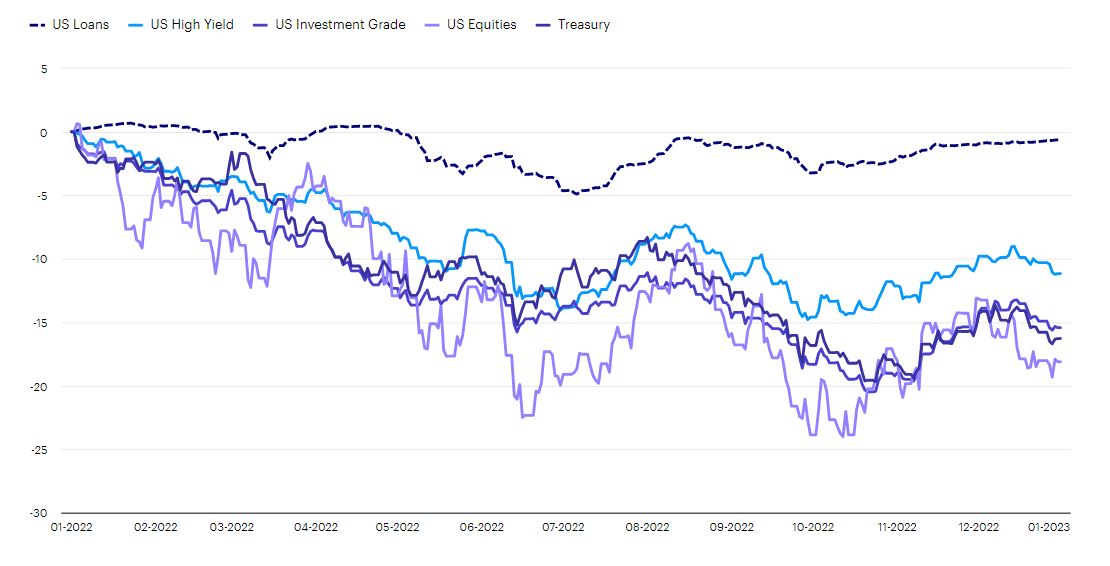
Source: Pitchbook LCD, Bank of America, Merrill Lynch, Bloomberg data as of December 31, 2022.
If you think our Alternative Scenario is more likely to come to bear – i.e., that inflation will prove stubborn with central banks tightening for longer – private credit assets could prove attractive. Many private credit investments have floating rates, meaning that the coupons investors are paid increase as interest rates rise. This can help mitigate inflation and interest rate risk.
If the Fed continues to raise interest rates, investors may start to become concerned about issuers’ ability to service their debt. However, while interest coverage ratios would likely decline in this scenario, the average borrower has entered this cycle in a strong position.
Why we think the Base Scenario is one of ‘disinflation’
The outlook for fixed income is inextricably bound up with the outlook for growth versus recession. After a sharp rebound from the deep global recession in 2020, there appears to have been a loss of momentum. It’s not just the manufacturing sector that’s suffering, with housing markets and housebuilding activity also weakening in many countries (the US, for example). To the extent that inflation is squeezing real incomes, Europe is the most likely to suffer recession, in our opinion. This is due to the high natural gas prices in the region – a result of limited supply from Russia (and Europe’s desire to find other energy sources). The negative effect of the trade sanctions imposed upon Russia are also most likely to be felt in Europe. On the other hand, because China has suffered less inflation than many other large economies, with a central bank that has been easing (due to a weak economy), we suspect it can escape the worst of the slowdown in the West.
We think that inflation will fall in most countries during 2023. Firstly, the proximate causes of inflation such as rising commodity prices and supply chain disruptions are now less present. Indeed, commodity prices have been falling over recent months and the and the year-on-year gain has now turned negative. Hence, commodity prices are starting to depress rather than boost inflation. Consequently, we expect headline inflation to fall below core inflation in most countries over the coming months and quarters, which then leaves the question about what will happen to core inflation.
Moving away from the proximate causes of inflation and focusing on the root causes, we suspect the aggressive monetary expansion of recent years was the culprit. Governments had to protect business and household cash flows during the early stages of the pandemic to avoid a deep recession. This required a large rise in government debt, which was facilitated by central banks, especially those that engaged in bond purchases. Figure 7 shows how the acceleration in US money supply growth was followed by an uptick in core inflation. However, money supply growth is now much lower. We believe this opens the possibility of a future decline in core inflation. More concretely, we believe that wage growth is a cyclical phenomenon that will be tempered by higher unemployment. Also, the rise in housing cost inflation (rental costs etc.) is likely to subside as house prices come down, in our opinion.
Figure 7. US money supply and core inflation (% yoy)
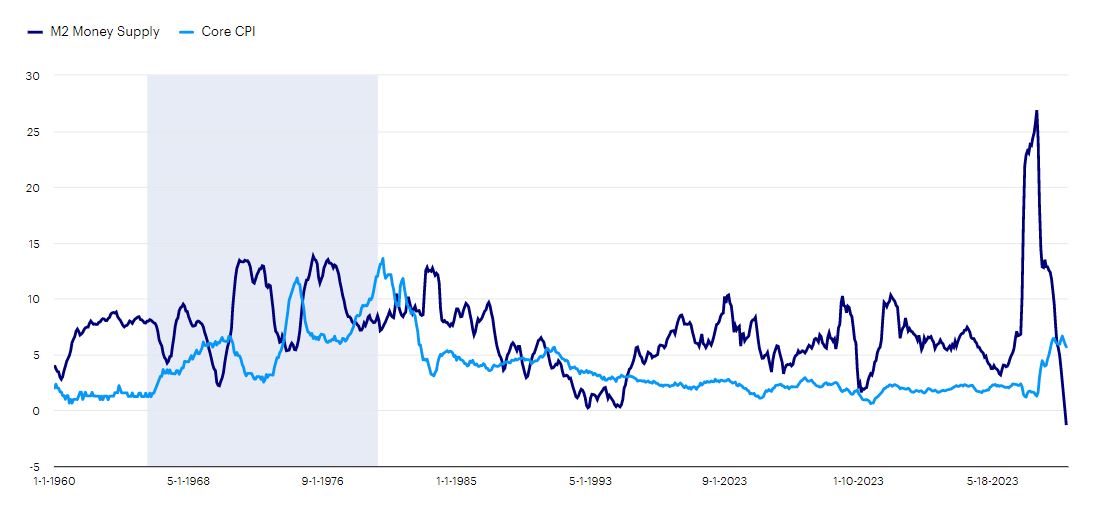
Based on monthly data from January 1960 to November 2022. The shaded area is from January 1965 to January 1980. Source: Refinitiv Datastream and Invesco
We presume that central banks will not wait until inflation falls to their target levels before calling an end to rate hikes. We suspect they will simply need proof that inflation is heading in the right direction. Financial markets would seem to agree, with market implied rates suggesting an expectation that major central bank rates will peak in the middle of 2023, with the possibility of rate cuts by the end of 2023. The supposition is that the Fed and the BOE are closer to the end of their rate hiking cycles than the ECB. We presume this will continue to weaken the US dollar during 2023 (a currency that we believe is expensive and has now peaked).
Last year turned out be more eventful than anticipated from a political perspective. The results of Australian, Brazilian and French elections were as expected, but US mid-term elections were not. UK politics also shook global markets in September. However, the biggest geopolitical move last year (Russia’s invasion of Ukraine) was largely unexpected and may have contributed to a widening of risk premia across financial assets.
Looking ahead, stalemates between Democrats and Republicans in Washington and between Russia and Ukraine may be the dominant themes of 2023, with Sino-US tensions never far away. Now that the US House of Representatives is under Republican control, it is likely that debt ceiling stand-offs will again become a regular feature of the legislative process, which could unsettle markets from time to time.
Though scheduled 2023 elections are unlikely to be of consequence for global markets, in our opinion, a number could be interesting. UK local elections could show whether Rishi Sunak has repaired the damage done to the Conservative Party’s standing over recent years. Spain’s elections appear likely to provide a swing from left to centre-right (based on opinion polls), though forming a government could again be difficult. Finally, opinion polls suggest that Turkey’s presidential election could see defeat for President Erdogan, no matter who stands for the Republican People’s Party (if it is a free and fair election).
With contributions from Invesco editorial and investment teams
Why Invesco for fixed income?
Whether you’re looking for income, diversification, capital preservation or total returns, our global fixed income teams have the strategies, the scale and the flexibility needed to match your objectives as markets evolve.
We have more than 200 fixed income specialists who invest across regions, investment styles and capital structures. Their expertise spans the entire fixed income spectrum, covering credit, rates and currencies.
Source: Invesco as of 31 December 2022.
Appendix: Definitions of data and benchmarks
Sources: we source data from Refinitiv Datastream unless otherwise indicated.
Inflation data sourced from official statistics agencies. Data is subject to change, revision or rebasing.
1https://www.ons.gov.uk/economy/inflationandpriceindices/timeseries/czoh/mm23 - Data as at November 2022
2https://www.insee.fr/en/statistiques/serie/000442434 - data as at December 2022
3https://www.destatis.de/EN/Themes/Economy/Prices/_Graphic/_Interactive/cpi-top20-month.html - Data as at November 2022
4http://dati.istat.it/Index.aspx?QueryId=23143&lang=en – Data as at November 2022
5https://www.ine.es/jaxiT3/Datos.htm?t=50905 - Data as at November 2022
6https://www.cbs.nl/en-gb/figures/detail/83132ENG - Data as at November 2022
7https://www.statistikdatabasen.scb.se/pxweb/en/ssd/START__PR__PR0101__PR0101A/KPI19Bas1980/table/tableViewLayout1/ - Data as at November 2022
8Paul Jackson’s views do not necessarily reflect the views of investment teams nor drive their asset allocation.
Cash: returns are based on a proprietary index calculated using the Intercontinental Exchange Benchmark Administration overnight LIBOR (London Interbank Offer Rate). From 1st January 2022, we use the Refinitiv overnight deposit rate for the euro, the British pound and the Japanese yen. The global rate is the average of the euro, British pound, US dollar and Japanese yen rates. The series started on 1 January 2001 with a value of 100.
Gold: London bullion market spot price in USD/troy ounce.
Corporate investment grade (IG) bonds: Bank of America Merrill Lynch investment grade corporate bond indices with historical ranges starting on 31 December 1996 for the Global, 31 January 1973 for the US dollar, 1 January 1996 for the euro, 31 December 1996 for the British pound, 6 September 2001 for the Japanese yen and 31 December 2004 for the China indices. The emerging markets yields and returns are based on the Bloomberg emerging markets corporate US dollar bond index with the historical range starting on 28 February 2003.
Corporate high yield (HY) bonds: Bank of America Merrill Lynch high yield indices with historical ranges starting on 29 August 1986 for the US dollar, and 31 December 1997 for the Global and euro indices.
Equities: Equity index valuations are based on dividend yields using Datastream benchmark indices with historical ranges starting on 1 January 1973 for the Global, US, Europe ex-UK and Japanese indices, 31 December 1969 for the UK index, 2 January 1995 for the Emerging Markets index and 26 August 1991 for the China A-Shares index.
Real estate: We use FTSE EPRA/NAREIT indices with historical ranges starting on 29 December 1989 for the US, Europe ex-UK, UK and Japanese indices, 18 February 2005 for the Global index, and 31 October 2008 for the Emerging Markets index.
Commodities: Goldman Sachs Commodity Index with historical ranges starting on 31 December 1969 for the All Commodities and Agriculture indices, 31 December 1982 for the Energy index, 3 January 1977 for the Industrial Metals index, and 2 January 1973 for the Precious Metals index. “Industrial commodities” is oil & gas and industrial metals.
Investment risks
The value of investments and any income will fluctuate (this may partly be the result of exchange rate fluctuations) and investors may not get back the full amount invested.
Important information
By accepting this document, you consent to communicating with us in English, unless you inform us otherwise. Data as at 15 December 2022 unless stated otherwise.
This document is marketing material and is not intended as a recommendation to invest in any particular asset class, security or strategy. Regulatory requirements that require impartiality of investment/investment strategy recommendations are therefore not applicable nor are any prohibitions to trade before publication. The information provided is for illustrative purposes only, it should not be relied upon as recommendations to buy or sell securities.
Where individuals or the business have expressed opinions, they are based on current market conditions, they may differ from those of other investment professionals, they are subject to change without notice and are not to be construed as investment advice.