
31 Jan 2024
Author: Simon Ward, Economic Adviser
Monetary trends suggest a coming inflation undershoot, argues Simon Ward, Economic Adviser.
Inflation continues to play out in line with the simplistic “monetarist” proposition of a two-year lead from changes in money to prices.
A further fall in inflation during the first half of 2024 could be accompanied by significant activity and labour market weakness, with corresponding underperformance among cyclical assets.
The underperformance of quality stocks in 2022 partly reflected an inverse correlation with Treasury yields, a relationship now suggesting further catch-up potential after a relatively strong 2023.
The money and cycles forecasting approach suggested that global inflation would fall rapidly during 2023 but at the expense of significant economic weakness. The inflation forecast played out, but activity proved more resilient than expected. What are the implications for the coming year?
One school of thought is that economic resilience will limit further inflation progress, resulting in central banks disappointing end-2023 market expectations for rate cuts, with negative implications for growth prospects for late 2024/2025.
A second scenario, favoured here, is that the economic impact of monetary tightening has been delayed rather than avoided, and a further inflation fall during the first half of 2024 (H1 2024) will be accompanied by significant activity and labour market weakness, with corresponding underperformance of cyclical assets.
The dominant market view, by contrast, is that further inflation progress will allow central banks to ease pre-emptively and sufficiently to avoid material near-term weakness and lay the foundation for economic acceleration into 2025.
On the analysis here, the second scenario might warrant a two-thirds probability weighting versus one-sixth for the first and third. This assessment reflects several considerations.
First, on inflation, developments continue to play out in line with the simplistic “monetarist” proposition of a two-year lead from money to prices. G7 annual broad money growth formed a double top between June 2020 and February 2021 – mid-point October 2020 – and declined rapidly thereafter. Annual CPI inflation peaked in October 2022, falling by 60% by November 2023 – chart 1.
Chart 1: The two-year lead from money to prices suggests an inflation undershoot ahead
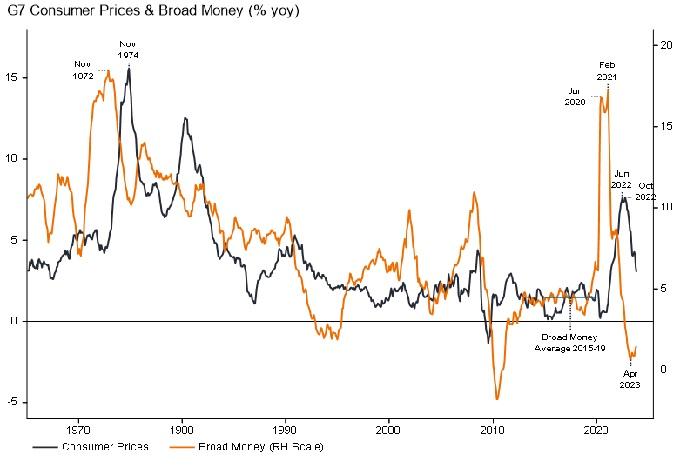
Source: LSEG Datastream, (31 December 1964 to 31 December 2023).
Broad money growth returned to its pre-pandemic average in mid-2022 and continued to decline into early 2023. The suggestion is that inflation rates will return to targets by the second half of 2024 (H2 2024) with a subsequent undershoot and no sustained revival before mid-2025.
Secondly, economic resilience in 2023 partly reflected post-pandemic demand/supply catch-up effects, which now appear complete. The moderate economic impact of monetary tightening to date, moreover, is consistent with historical experience. Major lows in G7 annual real narrow money momentum led lows in industrial output momentum by an average 12 months historically – chart 2. With a trough in the former reached as recently as August 2023, economic fall-out may not be fully apparent until H2 2024.
Chart 2: The economic impact of monetary tightening may not peak until the second half of 2024
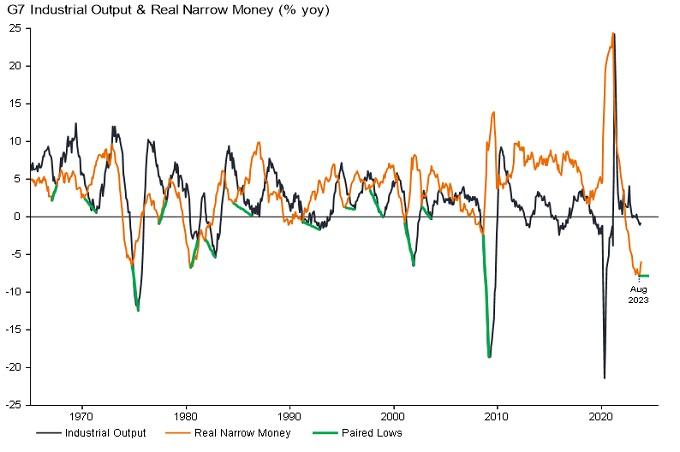
Source: LSEG Datastream, (31 December 1964 to 31 December 2023).
The suggestion that economic downside is incomplete is supported by a revised assessment of cyclical influences. The previous hypothesis here was that the global stockbuilding cycle would bottom out in late 2023 and recover during 2024. Recent stockbuilding data, however, appear to signal that the cycle has extended, with a recovery pushed back until H2 2024.
A resumed drag from stockbuilding may be accompanied by a further slowdown or outright weakness in business investment, reflecting recent stagnation in real profits – chart 3. Capex is closely correlated with hiring decisions, so this also argues for a faster loosening of labour market conditions.
Chart 3: Business investment may soften in response to recent profits stagnation
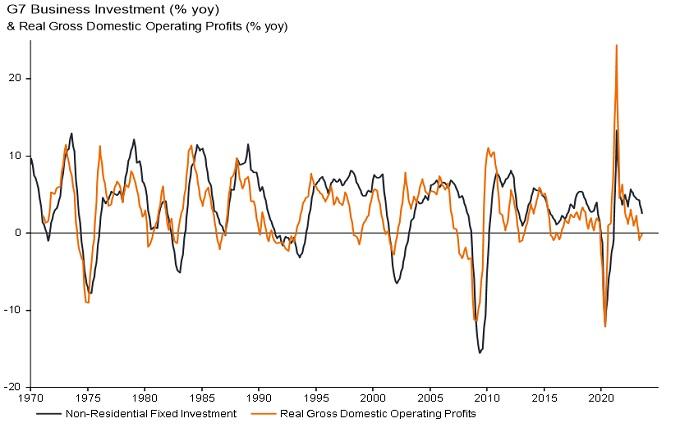
Source: LSEG Datastream, (31 December 1969 to 31 December 2023).
Real narrow money momentum remains weaker in Europe than the US, suggesting continued economic underperformance and a more urgent need for policy relaxation – chart 4. Globally, US/European revivals have been partly offset by a further slowdown in China, suggesting still-weakening economic prospects.
Chart 4: Relative money trends suggest weaker economic prospects in Europe
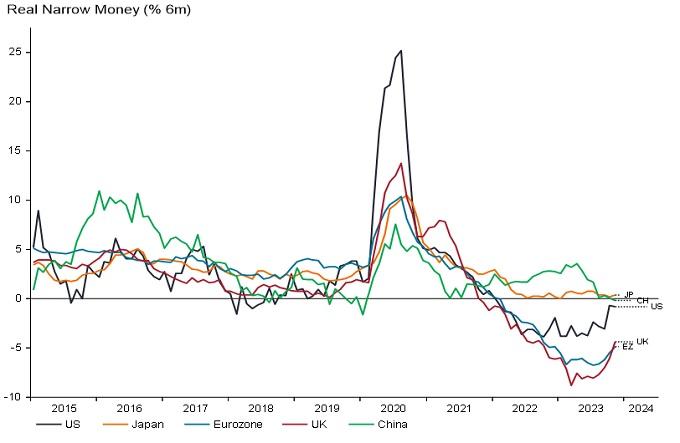
Source: LSEG Datastream, (31 December 2014 to 31 December 2023).
The frenetic rally of the final two months resulted in global equities delivering a strong return during 2023 despite the two “excess” money indicators tracked here* remaining negative. The indicators, however, started flashing red around end-2021, since when the MSCI World index has slightly underperformed US dollar cash.
Historically (ie. since 1970), equities outperformed cash on average only when both indicators were positive, a condition unlikely to be met until mid-2024 at the earliest.
The late 2023 rally was led by cyclical sectors as investors embraced a “soft landing” scenario. Non-tech cyclical sectors ended the year more than one standard deviation expensive relative to history versus defensive (excluding energy) sectors on a price/book basis – chart 5. Current prices appear to discount an early/strong PMI recovery, which the earlier discussion suggests is unlikely.
Chart 5: Cyclical sectors are discounting an economic recovery and may be vulnerable to disappointment
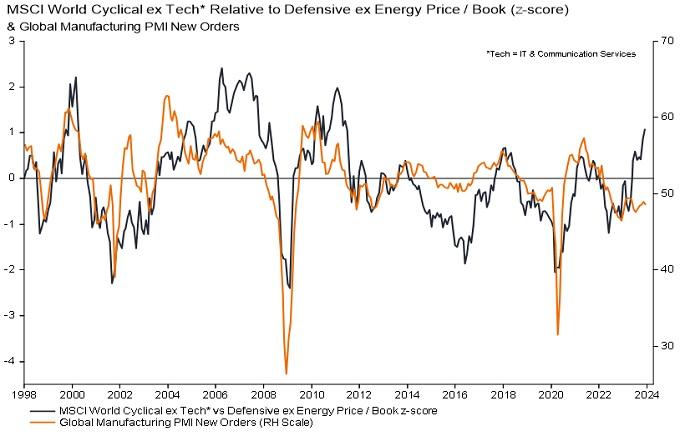
Source: LSEG Datastream, (31 December 1997 to 31 December 2023).
Quality stocks outperformed during 2023, reversing a relative loss in 2022 and consistent with the historical tendency when “excess” money readings were negative. Earlier underperformance partly reflected an inverse correlation with Treasury yields, a relationship now suggesting further catch-up potential.
A key issue for 2024 is the extent to which central bank policy easing will revive money growth. While inflation is expected to trend lower into early 2025, the cycles framework suggests another upswing later this decade – the 54-year Kondratyev price/inflation cycle last peaked in 1974. Aggressive US Federal Reserve easing 54 years ago – in 1970 – pushed annual broad money growth into double-digits the following year, creating the conditions for the final Kondratyev ascent. Signs that a similar scenario is playing out would warrant adding to inflation hedges.
*The differential between G7 plus E7 six-month real narrow money and industrial output momentum and the deviation of 12-month real narrow money momentum from a long-term moving average.
The views presented are as of the date published. They are for information purposes only and should not be used or construed as investment, legal or tax advice or as an offer to sell, a solicitation of an offer to buy, or a recommendation to buy, sell or hold any security, investment strategy or market sector. Nothing in this material shall be deemed to be a direct or indirect provision of investment management services specific to any client requirements. Opinions and examples are meant as an illustration of broader themes, are not an indication of trading intent, are subject to change and may not reflect the views of others in the organization. It is not intended to indicate or imply that any illustration/example mentioned is now or was ever held in any portfolio. No forecasts can be guaranteed and there is no guarantee that the information supplied is complete or timely, nor are there any warranties with regard to the results obtained from its use. Janus Henderson Investors is the source of data unless otherwise indicated, and has reasonable belief to rely on information and data sourced from third parties. Past performance does not predict future returns. Investing involves risk, including the possible loss of principal and fluctuation of value.
Not all products or services are available in all jurisdictions. This material or information contained in it may be restricted by law, may not be reproduced or referred to without express written permission or used in any jurisdiction or circumstance in which its use would be unlawful. Janus Henderson is not responsible for any unlawful distribution of this material to any third parties, in whole or in part. The contents of this material have not been approved or endorsed by any regulatory agency.
Janus Henderson Investors is the name under which investment products and services are provided by the entities identified in Europe by Janus Henderson Investors International Limited (reg no. 3594615), Janus Henderson Investors UK Limited (reg. no. 906355), Janus Henderson Fund Management UK Limited (reg. no. 2678531), (each registered in England and Wales at 201 Bishopsgate, London EC2M 3AE and regulated by the Financial Conduct Authority) and Janus Henderson Investors Europe S.A. (reg no. B22848 at 2 Rue de Bitbourg, L-1273, Luxembourg and regulated by the Commission de Surveillance du Secteur Financier).
Outside of the U.S.: For use only by institutional, professional, qualified and sophisticated investors, qualified distributors, wholesale investors and wholesale clients as defined by the applicable jurisdiction. Not for public viewing or distribution. Marketing Communication.
Janus Henderson is a trademark of Janus Henderson Group plc or one of its subsidiaries. © Janus Henderson Group plc.