

Matthew Bullock , EMEA Head of Portfolio Construction and Strategy | Mario Aguilar De Irmay, CFA, Senior Portfolio Strategist | Sabrina Geppert, Senior Portfolio Strategist
The Signal and Noise series from Janus Henderson’s Portfolio Construction and Strategy Team seeks to identify historical patterns and precedents through which we can view current market challenges, escape analysis paralysis and drive toward an actionable set of portfolio solutions.
The first and second posts in our Signal and Noise series were aimed at demystifying yield curve inversions and breaking down US recession risk. While both articles addressed the relationship among economic recessions, market returns and the associated investment implications, the question of whether or not we are headed for a recession isn’t necessarily the biggest concern for investors right now. After dramatic selloffs across both equities and fixed income this year, many investors are wondering if high stock-bond correlations mean the traditional 60/40 portfolio has lost its allure – i.e., the diversification potential that has historically defined stock-bond relationships.
Current short-term stock-bond correlations are high... so what?
Trailing six-month correlation between the S&P 500® Index and US Treasuries
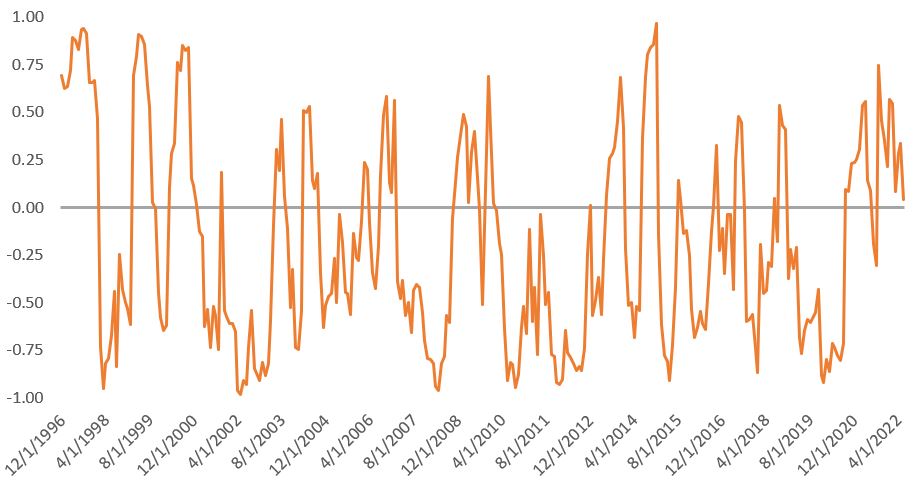 Source: Morningstar as at 30 June2022. Trailing six-month correlations between the S&P 500 Total Return USD and Bloomberg US Aggregate Total Return USD indices. Past performance does not predict future returns.
We would argue that this year’s parallel decline in both equity and fixed income is a result of the markets being drastically repriced amid the highest inflation levels we have seen in 40 years and central banks’ attempts to tame that inflation through quantitative tightening, putting an end to record-low interest rates. While painful, we believe this repricing should be viewed as a market correction, not a crisis. While many may worry that recent high stock-bond correlations signal the end of bonds’ diversification potential, past market sell-offs demonstrate that the bond market has consistently been able to provide a ballast during times of crisis.
Bonds have provided portfolio diversification in past market corrections
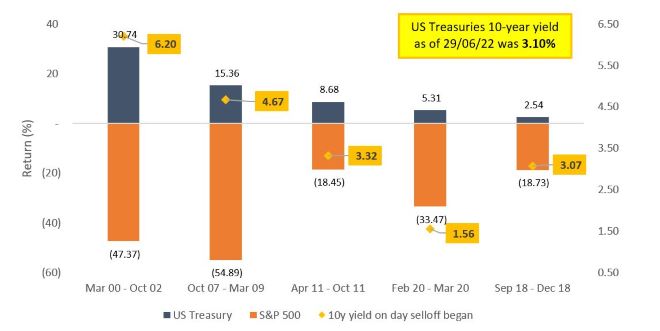 Source: Morningstar as at 30 June 2022. Trailing six-month correlations between the S&P 500 Total Return USD and Bloomberg US Treasury Total Return USD Indices. Past performance does not predict future returns.
Over the past 20 years, Treasuries have been able to provide the diversification investors seek in an equity market sell-off. Notably, this diversification potential comes regardless of where interest rates stand:
- Rates at the start of the 2011 downturn were similar to current levels. At that time, the credit rating for the US was downgraded, but the strength of US Treasuries as the largest and most liquid safe-haven asset class held strong. The market reacted by – believe it or not – buying US Treasuries. In other words, the US government’s ability to repay its debt was downgraded but its ‘safe haven’ allure remained and its borrowing costs became cheaper as a result.
- At the start of the COVID-19 pandemic, rates were roughly half of where they stand today, yet US 10-year Treasury yields fell from 1.56% to 0.76% returning 5.31% over the course of the equity sell-off (19 February to 23 March 2020).
While it is impossible to predict when and if the US will enter into a recession, we believe it is important to recognise that we are moving into a slower growth environment. With the US 10-year Treasury yield at 3.10% (as at 29 June 2022), the yield cushion on core fixed income is relatively high. Instead of worrying about correlation-related noise, we think investors should focus on the potential benefits of an allocation to core bonds as a risk diversifier within their portfolios.
The year-to-date sell-off across fixed income markets provides investors with many opportunities to increase exposure to historically defensive sectors with yields that have been more recently reserved for higher-risk areas of the market. Among these defensive sectors, we see opportunities to add to several areas of the securitised markets – particularly agency mortgage-backed securities, where yields tend to be materially higher than many other defensive sectors. However, we are mindful that these defensive sectors offer the most value if growth meaningfully slows and equity markets do in fact sell off from this point forward.
About the Portfolio Construction and Strategy Team
The PCS Team performs customised analyses on investment portfolios, providing differentiated, data-driven diagnostics. From a diverse universe of thousands of models emerge trends, themes and potential opportunities in portfolio construction that the team believes will be interesting and beneficial to any investor.
Note:
Diversification neither assures a profit nor eliminates the risk of experiencing investment losses.
10-Year Treasury Yield is the interest rate on US Treasury bonds that will mature 10 years from the date of purchase.
Bloomberg US Aggregate Bond Index is a broad-based measure of the investment grade, US dollar-denominated, fixed-rate taxable bond market.
Correlation measures the degree to which two variables move in relation to each other. A value of 1.0 implies movement in parallel, -1.0 implies movement in opposite directions, and 0.0 implies no relationship.
Equity securities are subject to risks including market risk. Returns will fluctuate in response to issuer, political and economic developments.
Fixed income securities are subject to interest rate, inflation, credit and default risk. The bond market is volatile. As interest rates rise, bond prices usually fall, and vice versa. The return of principal is not guaranteed, and prices may decline if an issuer fails to make timely payments or its credit strength weakens.
High-yield or "junk" bonds involve a greater risk of default and price volatility and can experience sudden and sharp price swings.
Mortgage-backed securities (MBS) may be more sensitive to interest rate changes. They are subject to extension risk, where borrowers extend the duration of their mortgages as interest rates rise, and prepayment risk, where borrowers pay off their mortgages earlier as interest rates fall. These risks may reduce returns.
Quantitative tightening is a contractionary monetary policy tool applied by central banks to decrease the amount of liquidity or money supply in the economy.
S&P 500® Index reflects US large-cap equity performance and represents broad US equity market performance.
US Treasury securities are direct debt obligations issued by the US Government. With government bonds, the investor is a creditor of the government. Treasury Bills and US Government Bonds are guaranteed by the full faith and credit of the United States government, are generally considered to be free of credit risk and typically carry lower yields than other securities.
A yield curve plots the yields (interest rate) of bonds with equal credit quality but differing maturity dates. Typically bonds with longer maturities have higher yields.