

16 Oct 2026
Fidelity’s Global Macro and Strategic Asset Allocation team explain why higher bond yields alone do not necessarily improve the appeal of government bonds. They outline what factors might support the case for extending duration in broader portfolios against an evolving investment backdrop.
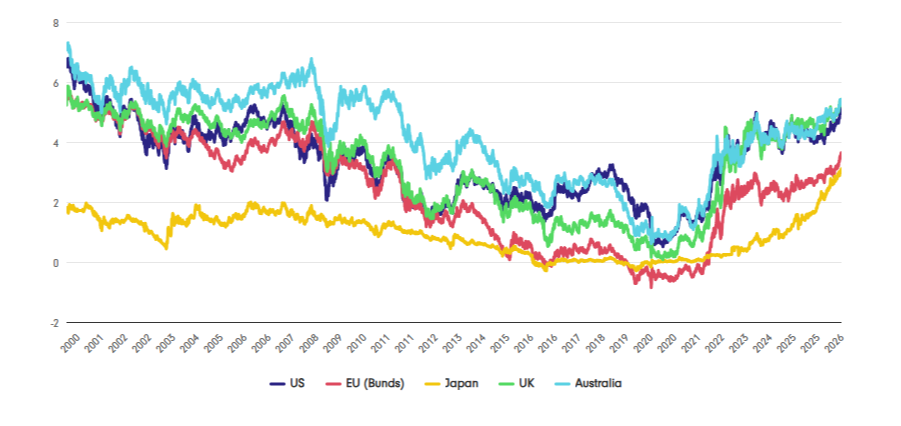
Government bond markets today look very different from the low-yield environment that followed the global financial crisis. Across developed markets, for example,10-year yields have returned to levels not seen for much of the past two decades.
Stronger nominal growth, persistent inflation and tighter monetary policy have driven much of the shift, while term premia have recovered from unusually compressed levels. Investors can once again earn income from high-quality government bonds, with higher starting yields providing some protection against further increases in interest rates.
Figure 1: Global government bond 10-year yields have recovered from post-GFC lows
Source: Fidelity International, Bloomberg, as at 30 September 2026.
Yet relatively high levels of income are also available from shorter-dated bonds. With market volatility high and bond-equity correlations positive, government bonds currently add to, rather than offset, equity risk. Geopolitical tensions leave markets exposed to further energy shocks, while fiscal pressure could push term premia higher.
The case for duration therefore depends on how much of the repricing is complete, what could push yields higher and whether weaker growth could turn the bond-equity correlation negative.
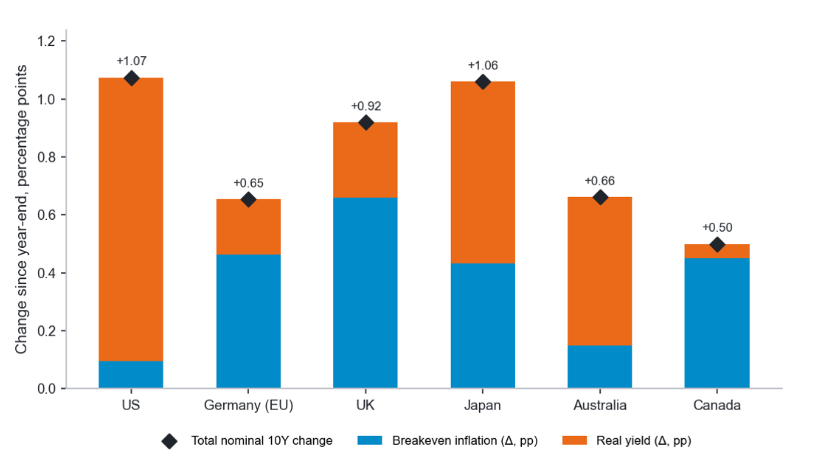
In the US, most of this year’s increase in 10-year nominal yields has come through higher real rates, rather than breakeven inflation. Oil supply shocks have added to near-term inflation pressure, while growth has remained resilient. With longer-term inflation expectations anchored, markets have responded by pricing a higher expected path for policy rates, in turn pushing up real yields. Elsewhere, the split between real rates and breakeven inflation has depended on domestic growth and inflation dynamics.
Figure 2: Real rates have been the key factor behind the recent rise in bond yields
Source: Fidelity International, Bloomberg, October 2026. For illustrative purposes only.
Note: Year-to-date change in generic 10-year nominal government bond yields decomposed into changes in 10-year real yields and breakeven inflation. Breakeven inflation calculated as nominal less inflation-linked yields.
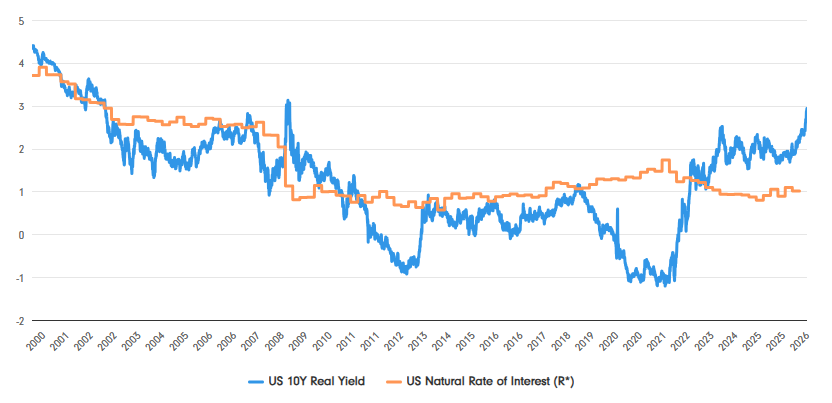
US 10-year real yields are now close to 3%, around their highest levels in 25 years and well above typical R* (the neutral real rate of interest that equilibrates the economy in the long run) estimates of around 1%. That is consistent with monetary conditions that may already be restrictive. From these levels, a further large rise in real yields would likely require stronger growth or more persistent inflation than markets are currently expecting.
Figure 3: Real yields are well above estimates of the neutral real rate
Source: Fidelity International, Bloomberg, October 2026.
Note: US 10-year real yield compared with the Holston-Laubach-Williams estimate of the US natural real rate of interest, (R*).
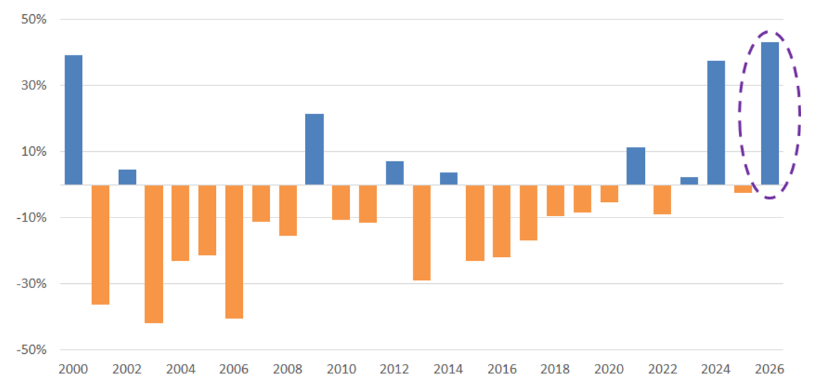
Another energy shock could still push real yields higher. The correlation between oil prices and US real yields has risen sharply in recent episodes. A larger or more persistent energy price shock could also begin to feed into longer-term inflation expectations, exerting upward pressure on nominal yields through both real rates and breakeven inflation.
Figure 4: Oil and US real yields have been unusually correlated this year
Source: Fidelity International, Bloomberg, September 2026. For illustrative purposes only.
Note: Calendar-year Pearson correlations of weekly changes in Brent crude oil with US 10-year real yields and 10-year breakeven inflation. Years with fewer than 40 weekly observations are excluded; 2026 is year to date.
Fiscal policy is a slower-moving but important factor affecting bond yields, mainly through the term premium channel. In the US, the fiscal deficit remains around 6% of GDP even though the economy is close to full employment. That is unusual for this stage of the cycle and points to a more structural deficit problem. Debt held by the public is already around the size of annual GDP and, on current projections, is heading towards roughly 110% of GDP by 2030, increasing the amount of Treasury supply investors must absorb.
Figure 5: US deficits remain large despite a strong labour market
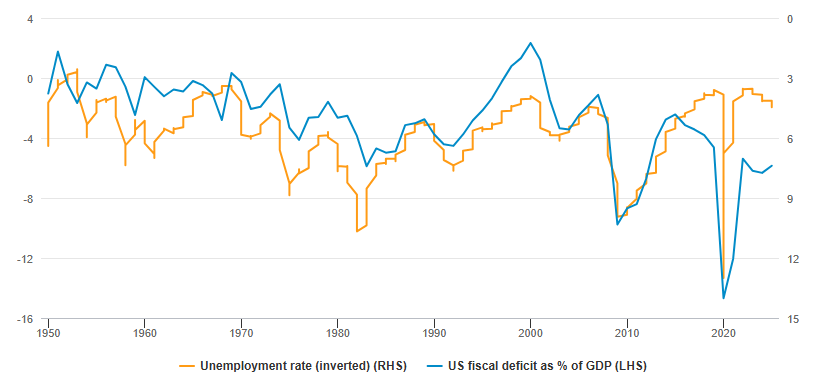
Source: Fidelity International, Marobond, U.S. Bureau of Labor Statistics (BLS), September 2025.
This is not an immediate debt-service problem because the effective interest rate on the existing debt stock remains below current market yields. But that buffer erodes as debt is refinanced. If yields stay high and deficits persist, interest costs rise, making debt stabilisation harder and keeping pressure on term premia. Fiscal sustainability concerns can be further amplified through the changing debt ownership structure. For example, US Treasury holdings have shifted towards more price-sensitive private investors and away from more price-insensitive holders, which could require a larger yield move to absorb additional supply.
AI investment adds another source of competition for capital. Hyperscaler and broader AI-related debt issuance is expected to rise further, while investment plans appear largely insensitive to borrowing costs. That additional supply could increase long-end yields’ sensitivity to issuance and exert upward pressure on term premia.
France’s 2026 deficit is now projected to be 5.4% of GDP, compared to prior expectations of 5%, after weaker growth, higher rates and inflation-linked spending. Beyond this, there are warnings that without consolidation the deficit could widen to 6.5% in 2027. The proposed budget requires a 1.2% of GDP primary structural consolidation just to return the deficit to 5%, still well above the European Commission’s 3% reference point. Passing that adjustment through a fragmented parliament ahead of the presidential election in six months’ time will be difficult. A watered-down budget looks the most likely route, while a rollover budget would bring more fiscal slippage and likely lead to continued uncertainty ahead of elections in spring.
The move in OAT-Bund spreads (the yield differential between comparable French and German government bonds) is a live example of the term-premium risk facing long bonds. Investors are pricing not only higher borrowing needs, but also the political difficulty of stabilising the deficit. For the ECB, French spread widening on its own may be insufficient to justify intervention via their Transmission Protection Instrument, given the country’s weak fiscal position. The ECB threshold is more likely to be spread widening beyond France. If pressure reaches countries with better fiscal fundamentals, such as Spain, the issue becomes less about national fiscal risk and more about monetary policy transmission – possibly meriting intervention in the long-end of the curve.
A higher term premium is consistent with the macro regime embedded in our Capital Market Assumptions. These forces all raise the compensation investors require to hold long-duration government debt.
Our US fair-value model captures them through debt-to-GDP growth, Treasury holdings by price-insensitive investors, macroeconomic volatility and the convenience yield. It points to a medium-to-long-term equilibrium term premium of around 1%, well above much of the 2012–2019 period.
Figure 6: US term premium has widened, with long-run fair value around 1M%
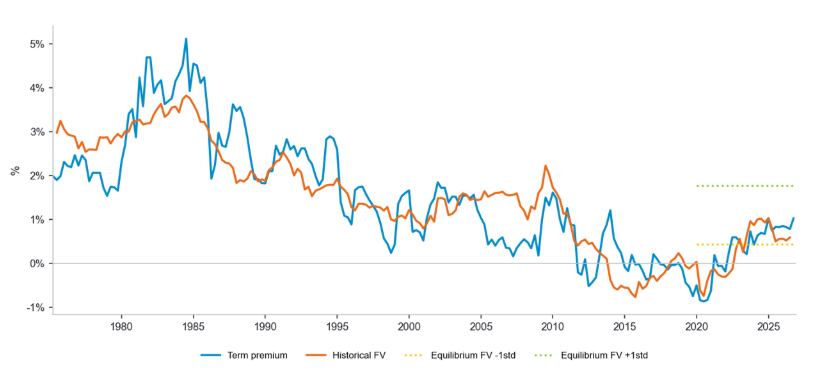
Source: Fidelity International, Bloomberg, Haver Analytics, September 2026. For illustrative purposes only.
Note: US 10-year term premium shown against historical and long-run equilibrium fair-value estimates. Historical fair value is estimated using Treasury holdings by US Banks’, federal debt/GDP, macroeconomic volatility and the Treasury convenience yield. Long-run equilibrium fair value is approximately 1.1%, with ±1 standard deviation of 0.66 percentage points.
That view also reflects our expectation that inflation and policy rates will settle above their 2010s averages. Term premia will continue to move through the cycle, but the unusually compressed levels of the post-GFC period are not the long-run anchor in our framework.
Higher yields alone do not make a strong case for extending duration. Yield curves are relatively flat, and investors can earn substantial income from shorter-dated bonds. Volatility also remains high, and the bond-equity correlation is positive. On all three measures, conditions are unfavourable for duration.
Figure 7: All three key portfolio construction variables are unfavourable for duration risk
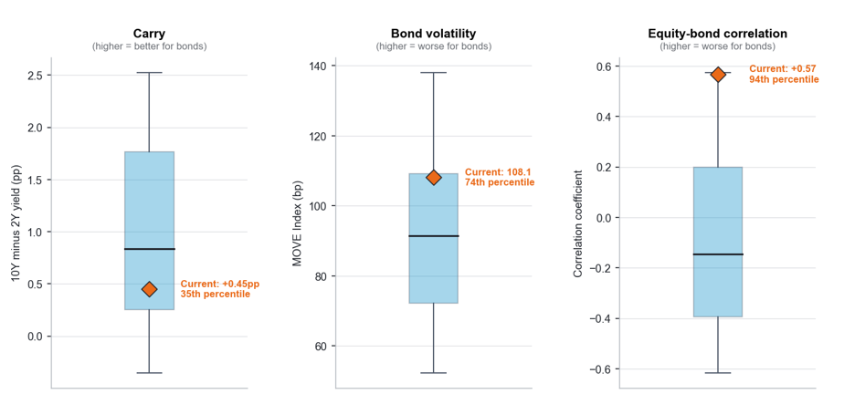
Source: Fidelity International, Bloomberg, October 2026. For illustrative purposes only.
Note: Distributions based on daily data from 1990 to present. Boxes show the 25th to 75th percentiles and whiskers the 5th to 95th percentiles. Carry is the US 10-year less 2-year Treasury yield; equity-bond correlation is the six-month rolling correlation between daily S&P 500 price return and S&P 7–10 Year US Treasury total returns.
The case for duration would strengthen if growth became the dominant macro risk. A sharp weakening in activity would put downward pressure on policy-rate expectations and bond yields as equities weakened, making the bond-equity correlation more likely to turn negative. In that environment, duration could once again offset part of the equity drawdown.
A sharp repricing of expectations for AI-related capital expenditure and earnings is one possible trigger. US equity markets are highly concentrated in a small group of companies tied closely to the AI investment cycle. A large cut in expected spending or earnings could weaken both equity returns and the broader growth outlook, potentially prompting markets to price a lower policy path and pull real yields down.
Higher yields improve income, but the right duration exposure depends on the dominant macro risk. Government bonds cannot be relied on to protect against inflation and energy shocks in the way they can against growth shocks.
For multi asset portfolios, diversification needs to extend beyond duration:
Important information
This material is for Institutional Investors and Investment Professionals only, and should not be distributed to the general public or be relied upon by private investors.
This material is provided for information purposes only and is intended only for the person or entity to which it is sent. It must not be reproduced or circulated to any other party without prior permission of Fidelity.
This material does not constitute a distribution, an offer or solicitation to engage the investment management services of Fidelity, or an offer to buy or sell or the solicitation of any offer to buy or sell any securities in any jurisdiction or country where such distribution or offer is not authorised or would be contrary to local laws or regulations. Fidelity makes no representations that the contents are appropriate for use in all locations or that the transactions or services discussed are available or appropriate for sale or use in all jurisdictions or countries or by all investors or counterparties.
This communication is not directed at, and must not be acted on by persons inside the United States. All persons and entities accessing the information do so on their own initiative and are responsible for compliance with applicable local laws and regulations and should consult their professional advisers. This material may contain materials from third-parties which are supplied by companies that are not affiliated with any Fidelity entity (Third-Party Content). Fidelity has not been involved in the preparation, adoption or editing of such third-party materials and does not explicitly or implicitly endorse or approve such content. Fidelity International is not responsible for any errors or omissions relating to specific information provided by third parties.
Fidelity International refers to the group of companies which form the global investment management organization that provides products and services in designated jurisdictions outside of North America. Fidelity, Fidelity International, the Fidelity International logo and F symbol are trademarks of FIL Limited. Fidelity only offers information on products and services and does not provide investment advice based on individual circumstances, other than when specifically stipulated by an appropriately authorised firm, in a formal communication with the client.
Europe: Issued by FIL Pensions Management (authorised and regulated by the Financial Conduct Authority in UK), FIL Investment Management (Luxembourg) S.à r.l. (authorised and supervised by the CSSF, Commission de Surveillance du Secteur Financier), FIL Gestion (authorised and supervised by the AMF (Autorité des Marchés Financiers) N°GP03-004, 21 Avenue Kléber, 75016 Paris) and FIL Investment Switzerland AG.
UAE: The DIFC branch of FIL Distributors International Limited is regulated by the DFSA for the provision of Arranging Deals in Investments only. All communications and services are directed at Professional Clients and Market Counterparties only. Persons other than Professional Clients and Market Counterparties, such as Retail Clients, are NOT the intended recipients of our communications or services. The branch is established pursuant to the DIFC Companies Law, with registration number CL2923, as a branch of FIL Distributors International Limited, registered in Bermuda. FIL Distributors International Limited is licensed to conduct investment business by the Bermuda Monetary Authority.
In Hong Kong, this material is issued by FIL Investment Management (Hong Kong) Limited and it has not been reviewed by the Securities and Future Commission.
FIL Investment Management (Singapore) Limited (Co. Reg. No: 199006300E) is the legal representative of Fidelity International in Singapore. This document / advertisement has not been reviewed by the Monetary Authority of Singapore.
In Taiwan, Independently operated by Fidelity Securities Investment Trust Co. (Taiwan) Limited 11F, No.68, Zhongxiao East Road, Section 5, Taipei 110, Taiwan, R.O.C. Customer Service Number: 0800-00-9911.
In Korea, this material is issued by FIL Asset Management (Korea) Limited. This material has not been reviewed by the Financial Supervisory Service, and is intended for the general information of institutional and professional investors only to which it is sent.
Issued in Japan, this material is prepared by FIL Investments (Japan) Limited (hereafter called “FIJ”) based on reliable data, but FIJ is not held liable for its accuracy or completeness. Information in this material is good for the date and time of preparation, and is subject to change without prior notice depending on the market environments and other conditions. All rights concerning this material except quotations are held by FIJ, and should by no means be used or copied partially or wholly for any purpose without permission. This material aims at providing information for your reference only but does not aim to recommend or solicit funds /securities.
For information purposes only. Neither FIL Limited nor any member within the Fidelity Group is licensed to carry out fund management activities in Brunei, Indonesia, Malaysia, Thailand and Philippines.
FIL Investment Management (Australia) Limited (ABN 34 006 773 575, AFSL No. 237865) and FIL Responsible Entity (Australia) Limited (ABN 33 148 059 009, AFSL No. 409340) are the legal representatives of Fidelity International in Australia. This is intended as general information for a person who is a "wholesale client" under section 761G of the Corporations Act 2001 (Cth) and has been prepared without taking into account any person’s objectives, financial situation or needs. Not for distribution to or use by retail clients.
GCT261020GLO