01 Jun 2023
"The pandemic and energy crisis have galvanised the region's leaders and put an end to a prolonged period of punishing austerity and negative interest rates"
European equities have broadly outperformed US stocks since September 2020. Initially benefitting from a global rotation away from Growth to Value stocks, more recent momentum has been driven by earnings upgrades as Europe has coped much better than feared without Russian gas. In this piece, we question whether Europe’s turn in the limelight is a one-off. Our view is that on a medium-term horizon, the region’s outlook has structurally improved. We think investors might want to strategically reconsider this unloved part of the global stock market.
Emerging from the doldrums
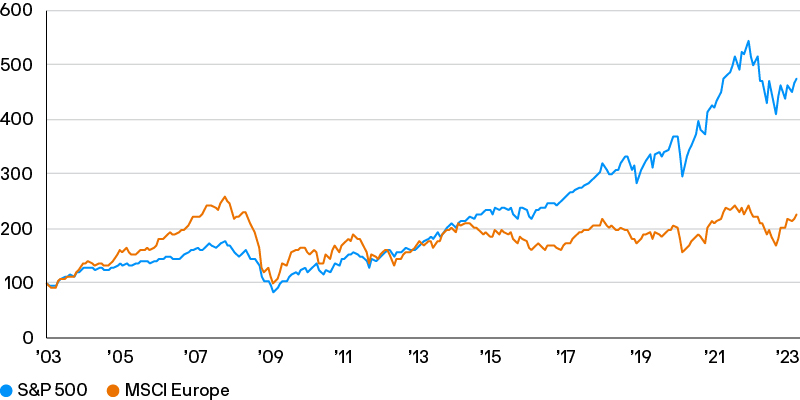
Younger investors, or those with short memories, will not recall a time when European stocks were the engine of portfolio returns. Between the Global Financial Crisis (GFC) and the Covid-19 pandemic, the S&P 500 rose at an annual rate of 11%, versus just 2% for the MSCI Europe in US dollar terms1. Stock prices languished because earnings languished. S&P earnings grew by 14% per year on average, while European companies could not manage that growth rate over the entire decade2.
But European stocks have not always been laggards. Equity investors with longer memories will remember that after the dot com boom, Europe’s indices were the darlings of developed markets. From 2003 to 2007, the MSCI Europe recorded an annualised price return of nearly 20%, almost double that of the S&P 500 (Exhibit 1). Equally, trailing earnings grew at an astonishing rate of 26% per year on average, again close to twice the earnings growth achieved by the S&P 500. While we do not see Europe returning to quite that magnitude of earnings expansion, it is worth remembering that the region’s equity market has not always been an underperformer.
Exhibit 1: US and Europe equity market performance
Price return, rebased to 100 in January 2003
Source: MSCI, Refinitiv Datastream, S&P Global, J.P. Morgan Asset Management. Returns shown are in USD. Past performance is not a reliable indicator of current and future results. Data as of 30 April 2023.
Austerity was a key part of Europe’s ‘lost decade’
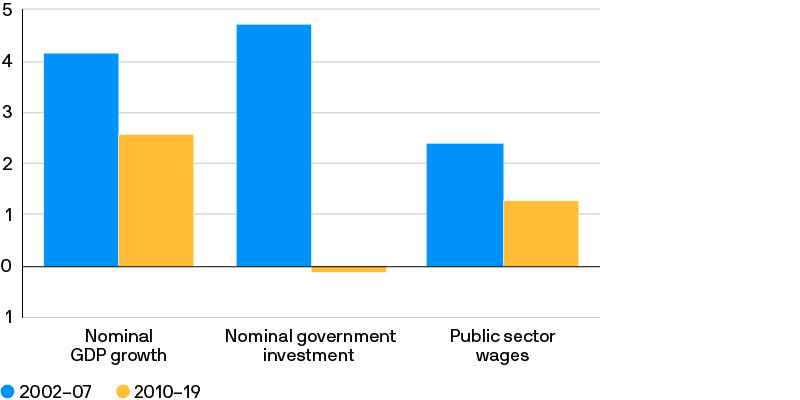
Europe’s stagnation over the last ten years was unsurprising given the macro environment. The eurozone lurched from the GFC to its unique sovereign debt crisis, which sparked an extended period of fiscal austerity. The scale of the fiscal restraint across government investment, employment and public sector pay was dramatic (Exhibit 2).
Exhibit 2: Eurozone macroeconomic performance
%, average annual growth rates
Source: European Commission, Eurostat, Refinitiv Datastream, J.P. Morgan Asset Management. Data as of 19 May 2023.
Deeply contractionary fiscal policy forced European monetary authorities to adopt ever looser monetary policy in a futile attempt to meet their inflation target. Both the economic and policy landscapes diverged from the US, and the term ‘US exceptionalism’ became more widely used to characterise the US’s economic and stock market outperformance, which in turn put upward pressure on the dollar.
Sector composition didn’t help
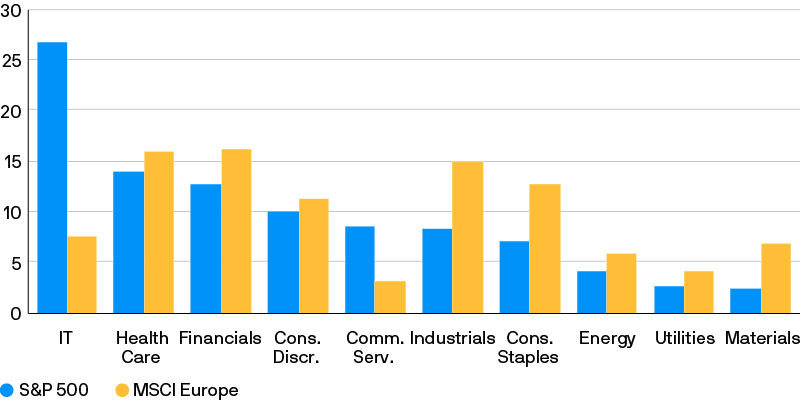
The sectors that dominated many of Europe’s benchmarks were those that felt the post financial crisis drag of low growth and low interest rates most acutely. European equity indices’ sector composition leans towards financials, energy, industrials and mining (Exhibit 3). The introduction of zero or negative interest rates to counter deflation risks caused banks’ return on equity to plunge, and Europe’s benchmarks were sadly lacking in the tech stocks that global investors were willing to pay an increasingly heavy premium for in a world in which growth was scarce.
Exhibit 3: US and Europe equity index sector weights
% of total market cap
Source: MSCI, Refinitiv Datastream, S&P Global, J.P. Morgan Asset Management. Real estate is not included in this sector breakdown due to its small size in each index. Past performance is not a reliable indicator of current and future results. Data as of 19 May 2023.
Times have changed
Recent structural changes mean the return of Europe’s stock market to the limelight could be more than just a passing phenomenon. The EU’s institutional framework has been reformed to allow common debt issuance to finance certain projects, which has dramatically changed the role fiscal policy will play in the economy over the medium term. An example is the Recovery Fund (also called NextGenerationEU), a scheme which allocates money for investment projects to member states if they implement certain structural reforms. The sums involved are vast – the potential grants to Italy total 5% of its 2021 GDP. The scheme’s conditionality and the nature of the debt (issued at the supranational level) could also boost long-run productivity. For example, to receive Recovery Fund grants, Italy has had to implement a number of reforms to its judicial system, which has often been blamed for poor capital allocation and sluggish growth and productivity.
Last year, it might have appeared that progress would be overwhelmed by the challenges posed by a war on Europe’s doorstep, as Russia’s invasion of Ukraine led to soaring energy costs. It looked as though the region would be faced with a prolonged period of high gas prices and the risk of rationing.
However, Europe is coping surprisingly well. Having successfully replaced Russian pipeline gas with American LNG, it came into last winter with its gas storage tanks full. Since then, a combination of consumer and industrial prudence and warm weather has led to relatively little storage drawdown versus normal seasonal patterns. As a result, wholesale gas prices have returned to levels seen prior to Russia’s invasion of Ukraine.
European governments have risen to the challenge once again with additional spending planned under the REPowerEU programme announced in spring last year. The newer Green Deal Industrial Plan is a response to the Inflation Reduction Act in the US, and aims to incentivise domestic clean energy production, amongst other green objectives.
These joint spending programmes should not only raise nominal growth in the region but, in our view, also reduce the risk of a eurozone break-up, helping to justify a lower risk premium on eurozone assets. Put simply, populists in places like Italy will find it harder to whip up anti-EU sentiment amongst the electorate while there are such obvious benefits to being part of the bloc.
Bond markets have noticed the change, stock markets are less convinced
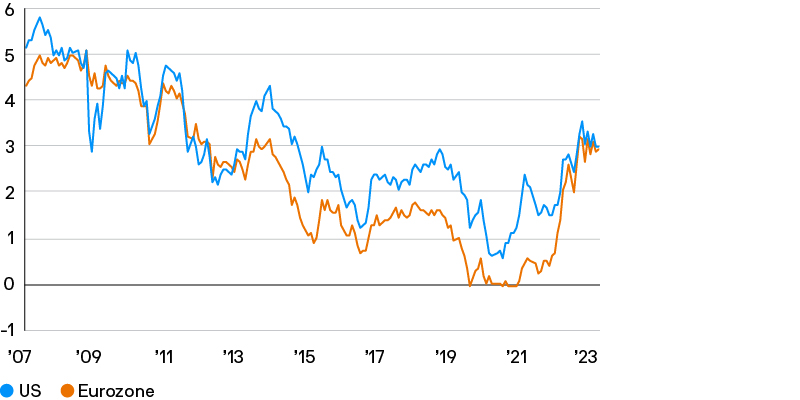
The bond market appears to agree that the eurozone has been dislodged from its low growth, low inflation rut. Euro 5y5y inflation and interest rate swaps have converged with US levels for the first time in several years (Exhibit 4), and medium-term pricing for the ECB’s deposit rate has settled at levels not seen since before the financial crisis.
Exhibit 4: Market-based interest rate expectations
%, 5y5y swap rate
Source: Bloomberg, J.P. Morgan Asset Management. The 5y5y swap rate represents the market’s expectations of five-year average interest rates, starting in five years. Past performance is not a reliable indicator of current and future results. Data as of 30 April 2023.
However, despite the bond market’s recognition of the improved nominal growth picture, almost every sector of the MSCI Europe still trades at an above average discount versus the US market (Exhibit 5). If bond pricing is right and we are set to see higher rates over the next decade compared to the last, this could support equity returns across a much broader range of sectors than the Growth-heavy leadership of recent years. Given Europe’s sector composition, a rotation towards Value would aid its equity market performance.
Beyond Value, the continent’s luxury goods companies and fiscally-supported climate tech and semiconductor firms also seem like opportunities for investors looking anew at European markets.
Exhibit 5: MSCI Europe relative valuation
Forward P/E ratio, % premium or discount versus S&P 500
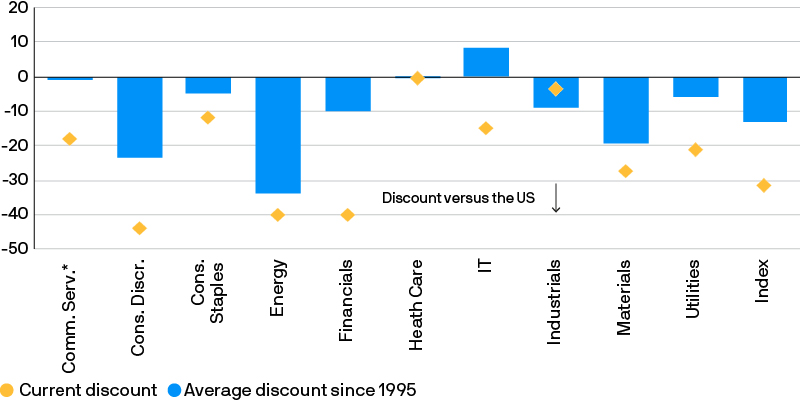
Source: MSCI, Refinitiv Datastream, S&P Global, J.P. Morgan Asset Management. Forward P/E ratio is price to 12-month forward earnings, calculated using IBES earnings estimates. Chart shows the current percentage premium or discount of the MSCI Europe index or sector forward P/E ratio to the equivalent S&P 500 sector or index forward P/E ratio, and the average since 1995. *Communication Services average is calculated using data 1995 to 2000 inclusive and from 2005 to date, due to sector composition changes. Past performance is not a reliable indicator of current and future results. Data as of 19 May 2023.
Conclusion
In our view, Europe has structurally improved. The pandemic and energy crisis have galvanised the region’s leaders and put an end to a prolonged period of punishing austerity and negative interest rates. Over the medium-term, we expect this to support nominal earnings in Europe in a way that current valuations do not appreciate. For that reason, we think investors may have been right to shun the continent’s stocks for much of the last decade, but they should now reconsider the role of European equities in their portfolios.
1 MSCI Europe rose at a 3.8% annual rate in EUR terms.
2 MSCI Europe 12-month trailing earnings grew just 4.2% from the start of 2010 to the end of 2019.